Lecture 7 - Stellar Classification (2/2/99)
 Binaries II --- | ---
Atomic Spectra

Reading:
Chapter 13-2, 13-3, 8-2 (ZG4)
Notes:
pages 24 - 27
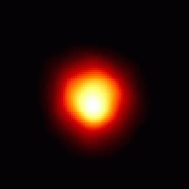
The disk of the red supergiant star Betelgeuse,
as
imaged by HST. The radius of this star would extend beyond
the orbit of Jupiter, were it our Sun! (Courtesy NASA/STSCI)
 |
Key Question: |
What is the main sequence?
|
|---|
 |
Key Principle: |
The H-R Diagram
|
|---|
 |
Key Problem: |
What is the origin of the
different stellar classes?
|
|---|
Investigations:
- Surveying the Stars
- What are the bulk properties of stars?
- Why do we look in the optical to survey for stars?
- How do you decide if a star is nearby or far away?
- Are bright stars bright because they are nearby or because
they are intrisically luminous?
- How close is the nearest star (other than the Sun)?
- What methods are there to measure distances to stars?
- For stars of the same effective temperatures, how is the radius
related to the luminosity?
- How do you use the Stefan-Boltzmann law to derive stellar radii?
- What is the mass-luminosity relation for main sequence stars?
- What is the mass-to-light-ratio for stars of different
luminosities?
- What does the M-L relation tell us about stellar lifetimes?
- Why are L and T the most readily obtained observables for stars?
- How is the color related to temperature and why?
- What physical variables do absolute magnitude and color
represent?
- What is a color-color diagram?
- What is a color-magnitude diagram?
- The H-R Diagram and Stellar Classification
- What is the Hertzsprung-Russell diagram and what is its
significance?
- How is a color-magnitude diagram related to the H-R diagram?
- What is the main sequence?
- What are the curves of constant radius on the H-R diagram?
- What are typical radii for main sequence stars?
- What are typical radii for white dwarf stars?
- What are typical radii for supergiant stars?
- What are the densities of white dwarf material?
- What does the H-R diagram of a star cluster of a given age look like?
- What clue to stellar structure and evolution does the H-R diagram
give us?
- How was stellar classification done by Annie Jump Cannon and the
Harvard group?
- What is the OBAFGKM stellar classification sequence?
- What are the Morgan-Keenan (MK) luminosity classes?
- What type is the Sun?
- What features in stellar spectra are used to determine the spectral
class?
- Spectral Lines and Atomic Physics
- Where do stellar spectral lines originate?
- What are absorption lines and emission lines?
- What is the significance of monochromatic spectral lines in
terms of the Planck relation E = hf?
- How did Ernest Rutherford discover the atomic nucleus?
- When was the electron discovered?
- What is the Coulomb electrical force?
- How should the hydrogen atom behave, in analogy with
a two body gravitational system?
Continuum Emission and Blackbody Radiation revisted
Stellar classes are essentially temperature classes. The colors
correspond to temperatures through the blackbody relation.
Opaque matter at a temperature T (in Kelvin) radiates a continuous spectrum
of light caused by the movement and collisions of atoms (and their electrons)
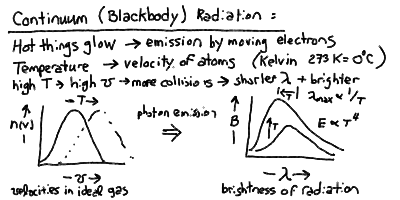
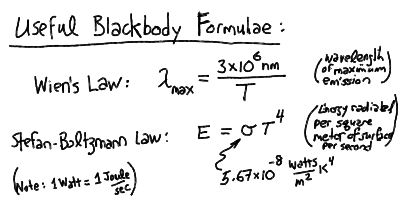
The peak wavelength of the blackbody radiation is inversely proportional
to the temperature, and the total power radiated per square meter of surface
is proportional to the fourth power of the temperature:
The HR Diagram: Mass-Luminosity-Radii Relations
The Hertzsprung-Russell (HR) diagram is the fundamental "tool" for
understanding stellar astrophysics. The fundamental quantities plotted
are log L vs. -log T. Variants of the HR diagram include the color-magnitude
diagram plotting absolute visual magnitude M_V vs. color B-V. Below is
an example of an HR diagram:

Given the luminosity and temperature, which determines a star's locus
in the HR diagram, we should then look at the radius and mass. First,
we can derive a relation for the radius using the Stefan-Boltzmann relation
and the surface flux:
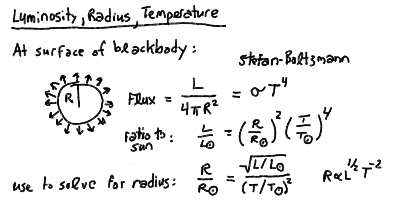
Thus, the lines of constant radius follow roughly the slope of the
main sequence. Stars above and to the right are larger (giants and
supergiants) and stars below and to the left are smaller (dwarfs).
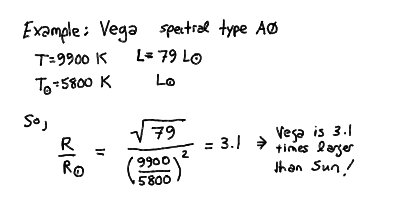
For example, we can apply this to the bright standard star Vega:
The mass of the star roughly increases with luminosity as you move
up the main sequence. However, the masses of stars not on the main
sequence are problematic. We will leave these until we better understand
stellar structure and evolution. There is an approximate power-law relation
for stars on the main sequence:
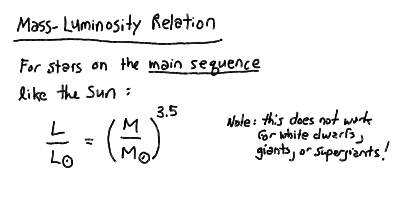
This holds for stars more massive than about 0.4 Msun.
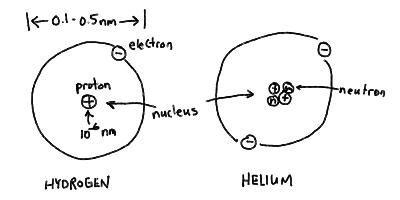
The Atom
Structure of the atom - nucleus and electron "cloud" for hydrogen
and helium:
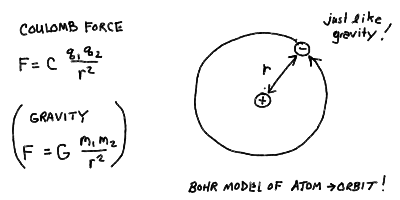
The Bohr model of the atom - electrons as orbiting "planets" in an
atomic "solar system":
Stellar Types in Outline:
- Thermal Continuum (Blackbody) Radiation
- Hot stuff glows
- The hotter stuff is, the brighter it glows
- The hotter stuff is, the bluer a color it glows
- Temperature measures the mean-square velocity (kinetic energy)
of the atoms in a substance, which jiggle around
- Temperature in astronomy is measured in degrees Kelvin (K).
A change of 1 K is the same as a change of 1 C.
0 K is absolute zero (no atom movement), 273 K = 0 C (water freezes),
373 K = 100 C (water boils).
- The characteristic spectrum generated by a hot opaque solid, liquid
or gas is called the thermal blackbody spectrum
- The blackbody spectrum reaches a maximum brightness at a wavelength
given by 3x10^6 nm / T
- The total energy emitted by a blackbody radiator at temperature T is
proportional to T^4
- The measure of radiated energy per unit time is the Watt (W), with
1 W = 1 J/s.
- Types of Spectra: Continuum, Emission, Absorption
- A hot dense (opaque) solid, liquid, or gas will produce a
continuous spectrum -> thermal blackbody radiation
- A low-density gas excited by radiation or collisions will emit
spectral lines -> emission line spectrum
- A low-density cooler gas in front of a hot continuum source will
absorb spectral lines -> absorption line spectrum
- Spectral Classes of Stars
- Can classify by the surface temperature T
- Wavelength of peak of thermal continuum can give rough value for
temperature
- The types of lines seen in spectrum are better indicator of
temperature
- Each specific line is strongest at a particular temperature such
that the transition energy is somewhat higher than the mean thermal
kinetic energy. Too low temperature, not enough atoms in the lower
level of transition beacause they are at lower levels. Too high
temperature, they are at higher levels.
- Can see ionized species of multi-electron atoms at the right
temperatures.
- At the highest temperatures, the hydrogen is ionized, and lines of
helium dominate.
- At the lowest temperatures, molecules can form in the coolest outer
parts and molecular absorption lines dominate the spectrum.
- For most medium temperature stars, the Balmer lines of hydrogen
are the most prominent spectral feature
- Spectral classes: O, B, A, F, G, K, M (decreasing in temperature)
- Each spectral class divided into sub-classes 0-9
- The Sun is spectral type G2 (T = 5800 K)
- Review of Atomic Structure
- Levels (orbits) labeled by n = 1,2,3,...
- Hydrogen Bohr Radius: r = 0.0529 nm n^2
- Hydrogen Energy Levels: E = -13.6 eV / n^2
- Wavelengths: 91.18 nm/ L = 1/n_low^2 - 1/n_up^2
- Ionization = removal of electron
- Hydrogen Ionization at energy gt; 13.6 eV (91.18 nm)
- Helium single ionization at 24.6 eV (50.4 nm)
- Helium fully ionized at 54.4 eV (22.8 nm)
- You can fit 2n^2 electrons on shell of level n
- Differentiate and label electrons by quantum numbers
n (radial), l and m (angular), and
spin s
- You can put 2 electrons in each orbital (n,l,
m) as long as they have opposite spins s=+/- 1/2
- The number l labels the electron orbits, or where on the
shell the electron is localized:
- l=0 is the s-orbital, which holds 2 electrons.
The s electron is equally likely to be found at any angle
on the shell.
- l=1 is the p-orbital, which holds 6 electrons.
The p electrons are concentrated at either ends of 3
perpendicular axes.
- The other orbitals are d (l=2), f (l=3), etc.
- The chemical properties of an element are determined by the orbitals
occupied by the outer valence electrons in the atom. This is how
the Periodic Table of the elements is arranged.
 Prev Lecture ---
 Next Lecture ---
 Astr12 Index ---
 Astr12 Home
smyers@nrao.edu
Steven T. Myers
 Binaries II --- | ---
Atomic Spectra

 Binaries II --- | ---
Atomic Spectra


 Prev Lecture ---
 Next Lecture ---
 Astr12 Index ---
 Astr12 Home