 GCNEWS
A Newsletter for Galactic Center Research
Currently edited by Sera Markoff, Loránt Sjouwerman, Joseph Lazio, Cornelia Lang, Rainer Schödel, Masaaki Sakano & Feng Yuan
email: gcnews@aoc.nrao.edu

 GCNEWS


Jenny E. Greene(1,2) & Luis C. Ho(3)
(1) Department of Astrophysical Sciences, Princeton University
(2) Hubble Fellow
(3) The Observatories of the Carnegie Institute of Washington
Our Galactic Center contains the nearest, and best-studied, supermassive black hole (BH). No observations of external galaxies may compete in angular resolution or depth. Still, we may learn whether our own supermassive BH is typical through the study of the demographics of nearby BHs, which has seen spectacular progress in the past decade. Dynamical measurements of the motions of stars or gas in the centers of nearby spheroids have revealed that BHs are a ubiquitous component of galaxy nuclei (e.g., Kormendy 2004) and that the mass of the BH is tightly correlated with the mass and structure of the surrounding spheroid (e.g., the MBH--σ relation; Gebhardt et al. 2000; Ferrarese & Merritt 2000; Tremaine et al. 2002).
Sgr A*, with a mass of 3.5 * 106 M0 (e.g., Ghez et al. 2005; Eisenhauer et al. 2005), happens to be amongst the lowest dynamical BH masses known. This does not, however, represent a real physical limit on supermassive BH masses. Rather, selection biases caused by the requirements of dynamical mass modeling severely limit the dynamic range in BH mass probed by these methods. Specifically, spiral bulges have been avoided because of dust, which limits the exploration of low-mass bulges. At the same time, resolving the gravitational sphere of influence of a 105 M0 BH is currently impossible beyond the Local Group. Therefore, at the present time, our only technique for probing the full distribution of supermassive BH masses is to use active galactic nuclei (AGNs; e.g., Greene & Ho 2004). We are particularly interested in the lowest BH masses because, while they constitute a negligible fraction of the present-day BH mass density, they provide one of the only nearby analogs of primordial BHs which ``seeded'' the growth of the large AGN we see today.
Here we present a newly selected sample of local broad-line AGNs from the Sloan Digital Sky Survey (SDSS; York et al. 2000), where local in this context means systems with redshifts z<0.35. We wish to examine the full range of BH masses in active systems; in particular, this will provide otherwise inaccessible information about the lowest-mass AGNs. At the same time, a comparison between the active and inactive BH mass function will show that the incidence of nuclear activity depends on BH mass. Locally, galaxies of similar mass to the Milky Way are far more likely to be active than are giant elliptical galaxies.
A warning is in order. In contrast to the measurements of Sgr A*, our ability to measure BH masses in active systems is very imprecise (factor of 4 uncertainties). Furthermore, we are sensitive only to the most vigorous accretion in the local Universe, with typical Eddington ratios of 10%. Nevertheless, as we will see, there is quite interesting information in the shape of the mass function of this population.

BHs are identified by the presence of broad Balmer emission lines (specifically Hα), where broad here means significantly broader than the narrow emission lines in the region (i.e., Hα+[NII] λλ 6548, 6583 and [SII] λλ 6716, 6731) and the line widths range from 700-10,000 km/sec . These are broad-line AGNs (sometimes called Type 1 AGNs), and not only does the broad emission tell us that the gas is moving in the very deep gravitational potential of a supermassive BH, but we can use the gas motions to estimate a virial mass for the central object. The typical emission region for the broad-line emitting gas can be measured based on the lag between variability in the AGN continuum and the corresponding variability in the broad emission flux. From these ``reverberation mapping'' experiments we derive average scaling relations between the AGN luminosity and the emission-region size (e.g., Kaspi et al. 2005). Combined with the average gas velocity measured by the broad-line width, we may then derive a ``virial'' mass for the central object.
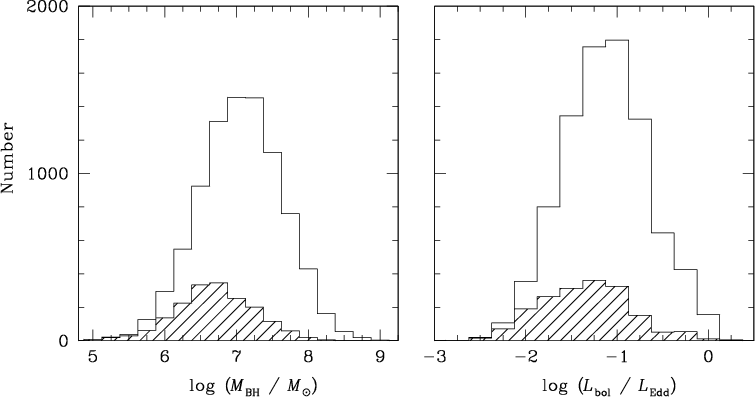
There are 8700 broad-line AGNs in the Fourth Data Release of the Sloan Digital Sky Survey, and Figure 1 shows the raw distributions in BH mass and Eddington ratio. The Eddington ratio is, in the usual way, the ratio of bolometric luminosity to the Eddington luminosity. However, keep in mind that unlike the case of the Galactic Center, we do not in general have the luxury of exquisite multi-wavelength data, and thus the ``bolometric'' luminosities here are simply scaled optical luminosities. In principle, one could do better using cross-correlations between the SDSS and either ROSAT, CHANDRA, or XMM. The main message of Figure 1 is that our typical source has a mass of 107 M0 and radiates at 10% of its Eddington limit. These objects are significantly more active than Sgr A* (indeed we would never detect an object radiating at the level of Sgr A*), and in general somewhat more massive. However, recall that a low-mass BH will have a low luminosity even when radiating at its Eddington limit, and so we must account for rather severe selection effects before we draw any strong conclusions about the distribution of BH mass in active systems.
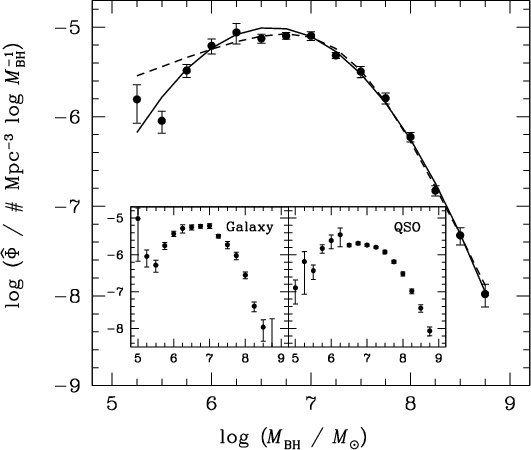
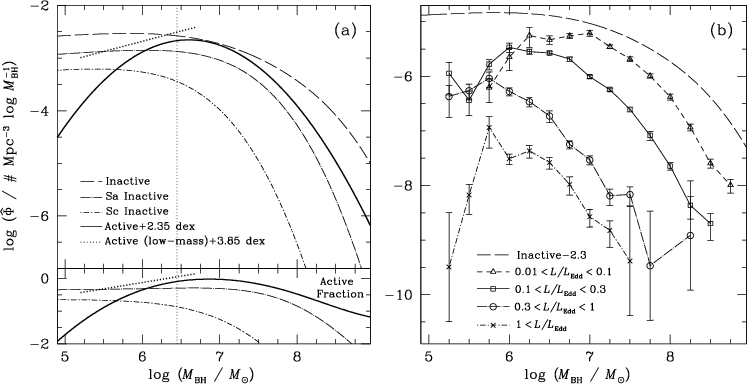
We can account for selection effects in a straightforward manner by assigning each AGN a maximum observable volume; faint objects get a large weight because they are only detectable in a small volume. Both the selection effects imposed by the SDSS targeting algorithm and the effect of our own spectroscopic selection algorithms are folded into the calculation. In Figure 2 we show the resulting BH mass function, appropriately weighted. Even this technique is limited at the lowest BH masses and Eddington ratios, since an entire class of objects is completely undetectable by our techniques. Sgr A*, were it active at 10% of Eddington, would be detectable in our survey out to a considerable volume. As one moves to even lower BH mass, both the AGN and the galaxy grow fainter and fainter. Therefore, the low-mass BHs that we do find tend to live in relatively luminous host galaxies. These complications make a determination of the slope of the BH mass function at low masses particularly challenging. To mitigate these effects, we fit mass functions in very narrow redshift and luminosity bins, over which the completeness is uniform. The dotted line in Figure 3a represents our best fit slope at low mass. We find evidence for a declining space density below 106.5 M0 at the 3 sigma level.
Our measurement of the space density of active BHs as a function of BH mass, combined with a measurement of the total distribution of BH mass in the Universe today, allows us to address how often a given system is active (the duty cycle) as a function of BH mass. Since there are tight correlations between BH mass and bulge luminosity, observed galaxy luminosity functions can be converted into an estimate for the total local BH mass. We use the techniques outlined in Marconi et al. (2004) to derive the inactive BH mass function shown as the long-dashed line in Figure 3a. The shapes of the active and inactive mass functions are quite different, meaning that the duty cycle is a strong function of BH mass. The charactistic inactive BH has a mass of 108 M0, while the active mass function peaks a bit below 107 M0. Heckman et al. (2004) found a very similar behavior in low-redshift narrow-line AGNs. Their BH masses are derived from measurements of bulge stellar velocity dispersions, while our masses do not rely directly on the MBH--σ relation, and so it is comforting that our two techniques agree.
BHs with masses similar to Sgr A* dominate the active (Lbol / LEdd 10%) BH population at low redshift. This is not terribly surprising. The most massive BHs are found in massive elliptical galaxies, which are gas-poor and are not forming many stars today.

They, and their BHs, presumably finished growing at higher redshift. Low-mass galaxies have younger stars, and a more ready supply of gas and they are more likely to display nuclear activity. Nevertheless, in detail the strong mass dependence must be explained quantitatively. For one thing, massive elliptical galaxies do have continuing gas supplies, either from late accretion and merging, or more simply just from the mass loss of the stars in the galaxy (e.g., Faber & Gallagher 1976). At the same time, we know that Sgr A* has a ready supply of gas and is relatively inactive; our observations suggest that BHs of comparable mass to Sgr A* are active 0.4% of the time. A 109 M0 BH is ten times less likely to be active today. These more massive BHs, however, are increasingly likely to be active at increasingly low accretion rates (e.g., Fig. 3b; Ho et al. 1997). Models of episodic AGN fueling in the local Universe ought to reproduce this observed mass dependence in the active fraction (e.g., Ciotti & Ostriker 2001).
Another interesting feature in the mass function is the apparent decrease in the duty cycle as one moves to even lower BH mass (<106 M0), although in general such galaxies are increasingly gas rich. BHs of such low mass are approaching the putative masses of seed BHs in the early Universe, and this downturn could signify a real physical lower limit to the mass of supermassive BHs. We know, in fact, that dwarf galaxies do not always contain a BH. For instance, M33, a bulgeless galaxy in the Local Group, does not appear to contain a nuclear BH (Gebhardt et al. 2001). On the other hand, we do not know how to convert the observed galaxy luminosity function into BH mass in this regime, since dwarf galaxies do not necessarily contain bulges. A combination of detailed study of the host galaxies of low-mass BHs (Greene et al. in prep) and alternate search techniques for low-mass BHs (e.g. deep radio surveys) should help disentangle whether the duty cycle or space density is declining faster at low BH mass.
