
 GCNEWS
A Newsletter for Galactic Center Research
This Volume was edited by Sera Markoff, Loránt Sjouwerman, Joseph Lazio, Cornelia Lang & Rainer Schödel
email: gcnews@aoc.nrao.edu
GCNEWS

R. Schödel1, R. Genzel2,3, F.K. Baganoff4, & A. Eckart1
1 I.Physikalisches Institut,
Universität zu Köln, Zülpicher Str.77, 50937 Köln, Germany;
rainer, eckart@ph1.uni-koeln.de;
2 Max-Planck-Institut
für extraterrestrische Physik, Giessenbachstraße, 85748 Garching,
Germany; genzel, ott@mpe.mpg.de;
3 also: Department of
Physics, Le Conte Hall, University of California, Berkeley,
California 94720, USA;
4 Center for Space Research, MIT,
Cambridge, MA 02139-4307; fkb@space.mit.edu
Due to the inhomogeneous distribution of the few dozen brightest stars in the nuclear cluster the location of Sgr A* does not coincide with the peak of the light distribution (Allen & Sanders 1986). However, with star counts based on deep, high-resolution NIR NACO/VLT images we could recently show with unprecedented accuracy that Sgr A* is indeed located (to +/-0.2'' or about 8 mpc) at the very center of the nuclear stellar cluster (Genzel et al. 2003; cf. also Scoville et al. 2003). Furthermore, we confirmed the existence of a stellar cusp within 1.5'' around Sgr A*, as expected from theoretical considerations (e.g. Bahcall & Wolf, 1977, 1978; Young 1980; Murphy, Cohn, & Durisen, 1991) and indicated in earlier data (Alexander 1999). The cusp follows a density law of the form
We also found new evidence that the stellar population in the cusp has distinctive characteristics compared to the outer cluster: The cusp KLF displays a lack of RC/HB stars and of giant stars, which may be due to mass segregation and/or destruction of stellar envelopes in the dense environment (Genzel et al. 2003). There is also the now well known, enigmatic population of blue, early-type stars (e.g. Genzel et al. 1997; Eckart, Ott, & Genzel, 1999; Figer et al. 2000; Gezari et al. 2002) in the immediate surroundings of the black hole. Only recently, Ghez et al. (2003) could show that one of these stars has indeed the spectroscopic characteristics of an O-type star (confirmed by Eisenhauer et al. 2003). Currently, there exist no satisfactory models on how such stars can form at this location or migrate there during their lifetime. Alternatively, they might be a different class of objects, similar to blue stragglers (see the discussions in Ghez et al. 2003 and Genzel et al. 2003). Slit-spectroscopy is unfortunately notoriously difficult in the extremely dense nuclear star cluster. However, we can hope for breakthroughs with the AO integral-field spectrometer SPIFFI/SINFONI at the ESO VLT, which will be commissioned this year. Understanding the properties of the enigmatic stellar population in the cusp is certainly one of the most intriguing subjects of GC study in the near future, not only for observation (spectroscopy, stellar dynamics), but also for theory (e.g. importance of stellar collisions in the dense cluster with high velocity dispersion).
In the last decade, measurements of the velocity dispersion in the central star cluster brought strong evidence for the black hole nature of Sgr A* (Eckart & Genzel 1996, 1997; Ghez et al. 1998; Genzel et al. 2000). However, compared to the recent estimates of the black hole mass through individual stellar orbits, MBH=3.5-4.0 * 106 Mo (Schödel et al. 2002; Ghez et al. 2003; Schödel et al. 2003; Eisenhauer et al. 2003), the dispersion measurements resulted in lower mass estimates, around 2.6 * 106 Mo. Although the reason for this discrepancy is not yet fully understood, we believe that it is most probably due to incomplete sampling of the cluster. A critical assumption of the statistical mass estimators is the availability of a sufficiently complete census of the stellar cluster. Earlier proper motion experiments (Eckart & Genzel 1996, 1997; Ghez et al. 1998) included just around a dozen high-speed stars in the central cusp due to the use of poorer instrumentation (no AO), smaller telescopes and/or due to conservative approaches in data analysis.
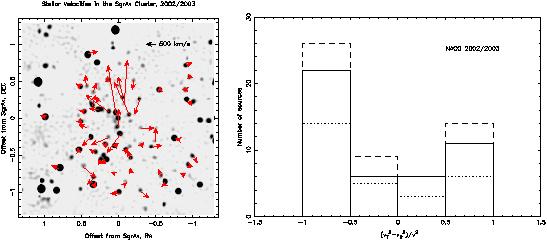
A recent, more rigorous approach by Schödel et al. (2003) resulted in an estimated enclosed dark mass of 3.4*106 Mo. Also, the deep, high-resolution AO GC images obtained with NACO/VLT since early 2002 allow pinpointing the location of the brighter (mK<=17) stars within 1'' of Sgr A* with an accuracy of the order <=2 mas, which allows for extracting proper motions with a time base of just two years. The measured proper motions (based on 5 epochs of observations) are shown in the left panel of Figure 1 and represent so-far the most complete sample. The enclosed mass, estimated with a Leonard-Merritt mass estimator is 4.0+/-0.8 Mo.
These recent works support our assumption that the earlier, lower mass estimates were due to incomplete sampling. One must also keep in mind the possible influence of other factors such as the slope of the central cluster (for an ample discussion, see Genzel et al. 2000), which leads to additional correction factors. However, these corrections are of the order <=10%.
Due to the enormous stellar number density in the cusp the nuclear cluster should relax rapidly via two-body collisions and display an isotropic velocity structure. Nevertheless, Genzel et al. (2000) found some indications of a prevalence of radial orbits in the cusp, which could be confirmed by the work of Schödel et al. (2003). Our newest, most complete proper motion data set (about 50 stars within 40 mpc of Sgr A*) still supports the weak (2-3 σ) but consistent finding of radial anisotropy (right panel in Figure 1). We find an anisotropy parameter < β > = 1 - <σt2>/<σr2> = 0.6 +/-0.05 (Schödel 2004). Of course, this finding might be due to small number statistics and/or reflect a perhaps random property of just the few brightest stars in the cluster (also, the error might be underestimated due to systematic errors not taken into account). On the other hand, should the anisotropy be confirmed further, it might give us a - not yet understood - clue to the formation of the cusp or some of its constituents.
The determination of Keplerian orbits of individual stars around Sgr A* in the last two years was an enormous breakthrough. Above all, the orbit of the star S2 has been measured with high accuracy It allowed to exclude dark cluster or fermion ball alternatives to the black hole scenario with high confidence, to measure the black hole mass independent of any statistical assumption, and to locate its position with an accuracy of <2 mas; Schödel et al. 2002, 2003; Ghez et al. 2003). Calculating the position (and its uncertainty) of S2 relative to Sgr A* in 2002.3 with the orbital elements given by Ghez et al. (2003, astro-ph/0306130) and by Eisenhauer et al. (2003), we obtain a relative offset of the dynamical center of the first solution from the latter one of 0.0+/-2.9 mas E and 0.8+/-2.0 mas N. This means that the two groups' results are in excellent agreement and that the position of Sgr A* is now known with an accuracy of 1 milli-arc-second.
Eisenhauer et al. (2003) used the orbit of S2 for the first geometrical determination of the distance to the Galactic Center, R0. Consistent with earlier indirect distance estimates, they found a value R0=7.9+/-0.4 kpc and a black hole mass of 3.6+/-0.6 Mo (including the uncertainty of the distance).
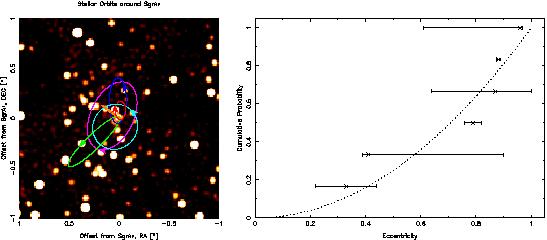
Ghez et al. (2003a) and Schödel et al. (2003)/Schödel (2004) determined and/or constrained the orbits of an additional five stars near Sgr A*. Although these orbits are not known as accurately as the orbit of S2, they provide, for the first time, direct - i.e. without any statistical assumptions - insight into the dynamics of the cluster. As for the distribution of the orbital eccentricities, they agree with an isotropic cluster, but cannot exclude radial anisotropy due to the large uncertainties and due to the limited number of stars with observed orbital motion. We show the cumulative probability function of the eccentricities along with the theoretical distribution for a cluster in the potential of a point mass in the right panel of Figure 2 (taken from Schödel 2004). Schödel et al. (2003) showed that one can generally expect an overall slight bias toward discovering orbits with eccentricities e>=0.9 in the cusp. However, since all the orbits (with perhaps one exception) have semi-major axes a<20 mpc (Schödel et al. 2003), they might rather be biased toward lower eccentricities.
The latest development in the analysis of individual orbits is using the available proper motion information to fit all orbits simultaneously and thus gain additional information, e.g. on the proper motion (or rather lack thereof) of Sgr A* relative to the surrounding cluster of stars (see Ghez et al. astro-ph/0306130).
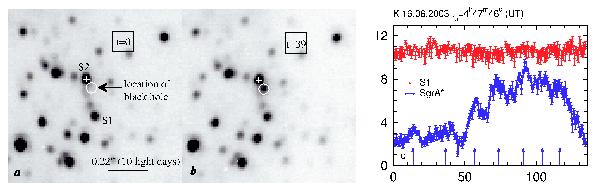
When observing the GC with the ESO NACO/VLT on the night from the 8th to the 9th of May, 2003, we experienced the perhaps most exciting event since the start of our GC monitoring program in 1991: We observed live on the real-time display how Sgr A* flared within a few minutes by a factor of 5 and faded again rapidly some 40 minutes later (left panel in Figure 3). For more than a decade we had been waiting for an event like this to happen! The position of the flare was coincident with Sgr A*, with an offset of -1.4+/-3.0 mas in R.A. and -0.2+/-3.0 in Dec. from the position of Sgr A* as determined from the orbit of S2. In subsequent observations in June we detected another 2 flares and found an additional one in a retrospective analysis of the data from 2002. With a total of four flares observed at wavelengths between 1.7 and 3.8 μm we estimated a flaring rate (assuming Poisson statistics) of 2 to 6 flares per day. Also, we detected a variable 'quiescent' source at the position of Sgr A*. Our results were published in \emphNature in October 2003 (Genzel et al. 2003a). Independently, A. Ghez and collaborators reported the detection of a variable source at the position of Sgr A* at 3.8 μm with the Keck telescope (Ghez et al. 2003, astro-ph/0309076, who also report on more than 6 orbits). The short rise-and-fall time scales (<=5 min) of the flares suggest that they come from within 10 Schwarzschild radii of the black hole. They have durations between 40 and 85 min, similar in scale to the X-ray flares (Baganoff et al. 2001). As for the SED of the flares, it is not well constrained in the NIR regime because we do not have any simultaneous measurements at different wavelengths so far. There is some indications that the flares have a blue color in the NIR regime (Genzel et al. 2003a). Should this prove to be true, then this would pose a serious problem for current theories of Sgr A* emission. In that case, the flares might be related to individual accretion events.
Most intriguingly, in two flares observed 24h apart in June 2003, we detected 17 min quasi-periodic oscillations (Figure 3, right panel). The oscillations have a frequency that is higher than the orbital frequency at the last stable orbit around a Schwarzschild black hole and suggest that we might have witnessed emission from material near the last stable orbit of a Kerr black hole. We determined a lower limit for the black holes spin of a = J/(GMBH)/c = 0.52 (+/-0.1, +/-0.08, +/-0.08), where G is the gravitational constant, MBH the mass of the black hole, J its spin, and c the speed of light. The errors in brackets include the influence of the uncertainties of MBH, the flare modulation frequency, and the distance to the GC. Should the quasi-periodicity of the flares be confirmed by upcoming observations then we could, for the first time, directly measure fundamental properties of our Milky Way's central black hole apart from its mass.
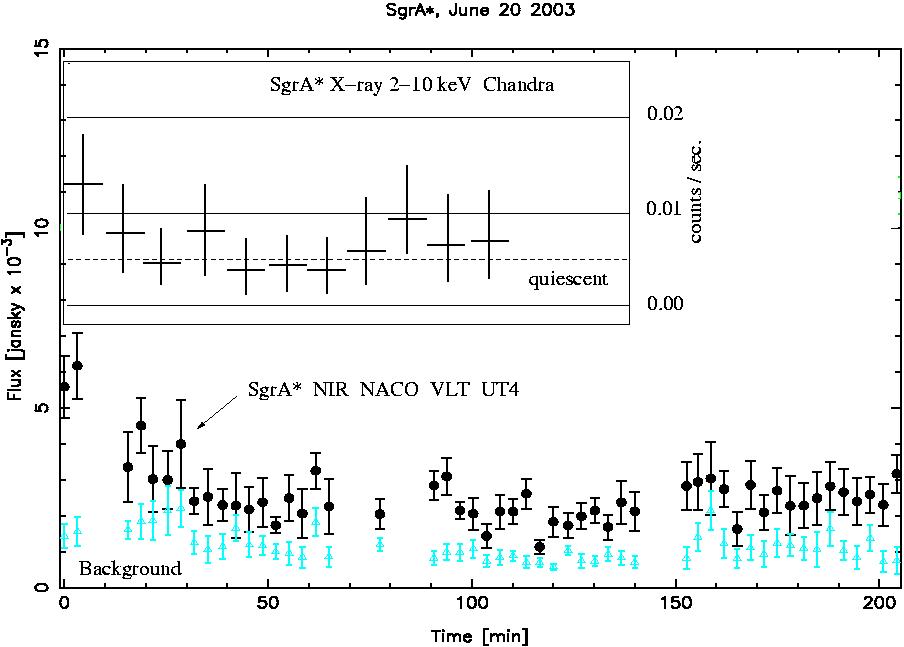
A decisive question for the emission mechanism is the relation between the flares at X-ray and NIR wavelengths. In an upcoming paper Eckart, Baganoff, Morris, Schödel et al. report on the first simultaneous near-infrared/X-ray detection of the SgrA* counterpart (Figure 4). The observations were carried out using the NACO adaptive optics instrument at the ESO VLT and the ACIS-I aboard the Chandra X-ray observatory. A fading flare of Sgr A* with >2 times the interim-quiescent flux was detected at the beginning of the NIR observations. This flare was also detected in the X-domain with a 2 - 10 keV luminosity of about 6*1033 erg/s. The data therefore represent the first simultaneous NIR/X-ray measurement of the interim-quiescent and flaring state of SgrA*. They find that the flaring state can be conveniently explained with a synchrotron self-Compton model involving up-scattered sub-millimeter photons from a compact source component showing bulk relativistic motion. The size of that component is assumed to be of the order of the Schwarzschild radius. The overall spectral indices αNIR/X-ray (Sν ~ ν-α) of both states are quite comparable with a value of 1.3. Since the interim-quiescent X-ray emission is extended, the spectral index for the interim-quiescent state is probably only a lower limit for the compact source Sgr A*. A conservative estimate of the upper limit of the time lag between the end of the NIR and X-ray flare is of the order of 15 minutes.
Very soon, the new GC season will start, with several coordinated radio/sub-mm/X-ray/NIR observing campaigns readily planned. The key question that will be addressed is the frequency and amplitude of the variability of Sgr A* observed simultaneously at different wavelengths. The new observations will provide essential and strong constraints for theoretical models of Sgr A* accretion and emission.
As concerns NIR observations, we are of course highly interested in measuring the flux of the Sgr A* counterpart at various wavelengths with as little time delay as possible. Polarization measurements will provide additional important information on the accretion flow/ejected material. We feel, however, that currently the most exciting aspect of the black hole emission remains the quasi-periodicity of the flares and strongly hope to confirm it.
Parallel to the work on Sgr A* we will of course continue our analysis of the stellar population and its dynamics. Possibly, the coming season will see the first SINFONI/SPIFFI/VLR AO integral-field spectroscopic observations of the Sgr A* cluster that will provide a wealth of new and essential information on the nature and 3D-dynamics enigmatic population of apparently young stars near the black hole.
References