
 GCNEWS
A Newsletter for Galactic Center Research
This Volume was edited by Angela Cotera, Sera Markoff & Loránt Sjouwerman
email: gcnews@aoc.nrao.edu
GCNEWS

Michael P. Muno
(Hubble Fellow; Department of Physics and Astronomy, University of California, Los Angeles, CA 90095; mmuno@astro.ucla.edu)
We compare the spectra of faint point sources and diffuse emission from a long Chandra observation of the Galactic center in order to place an upper limit on the fraction of the diffuse X-ray emission that could plausibly be produced by unresolved point sources. The diffuse X-rays can be described as emission from two collisional- equilibrium plasma components with kT ~ 0.8 keV and kT ~ 8 keV. The diffuse emission varies significantly both in intensity and spectrum on spatial scales of a few arcminutes. Therefore, unresolved point sources produce less than 40% of the total diffuse emission, and less than 45% of the putative kT ~ 8 keV emission. The surface density of unresolved point sources (inferred by extrapolating the number- flux distribution of observed sources) is remarkably consistent with the number of CVs expected in the field. The remaining hard, diffuse X-ray emission probably originates from a thermal or quasi-thermal plasma, or from interactions between cosmic ray electrons and background ions.
Several observational clues suggest that the emission is truly diffuse. For instance, the deepest Chandra observations of the Galactic plane find that point sources brighter than 3*10-15 erg cm-2s-1 contribute only 10% to the total diffuse Galactic ridge emission (Ebisawa et al. 2001). Likewise, ASCA observations of the Galactic plane reveal degree-scale variations in the intensity of the diffuse emission, which could only be produced by random variations in the numbers of point sources if they have intensities of 2*10-13 erg cm-2s-1 (Yamauchi et al. 1996). This apparently leaves no flux range over which point sources could account for all of the properties of the diffuse emission.
Nonetheless, the debate is not over. The variations in the intensity of the diffuse emission could be produced by any of several classes of extended X-ray features that have been discovered recently, including hot supernova remnants without radio counterparts (Bamba et al. 2003), magnetic filaments (Sakano et al. 2003; Lu, Wang, & Lang 2003), and X-ray reflection nebulae (Sunyaev, Markevitch, & Pavlinsky 1993; Murakami et al. 2000; Yusef-Zadeh, Law, & Wardle 2002). We may also have identified the actual point sources that comprise the apparently diffuse emission. Chandra observations of the Galactic center reveal that the faint stellar X-ray sources have spectra that are remarkably similar to that of the hard component of the diffuse emission (Wang et al. 2002). Moreover, the log(N)-log(S) distribution of resolved point sources within 20 pc of Sgr A* is so steep that the flux from unresolved point sources could explain all of the diffuse emission if the distribution extends down to only 10-16 erg cm-2s-1 (Muno et al. 2003a). Therefore, it still seems plausible that point sources produce the hard background emission observed throughout the Galactic ridge.
The perfect opportunity to examine this question in more detail was recently presented to us in the form of a 626 ks Chandra exposure of the 17' * 17' field around Sgr A*. Therefore, in this article, we compare the spectra of the point sources and diffuse emission in that field in order to place an upper limit on the fraction of the diffuse emission that is likely to be produced by unresolved point sources.
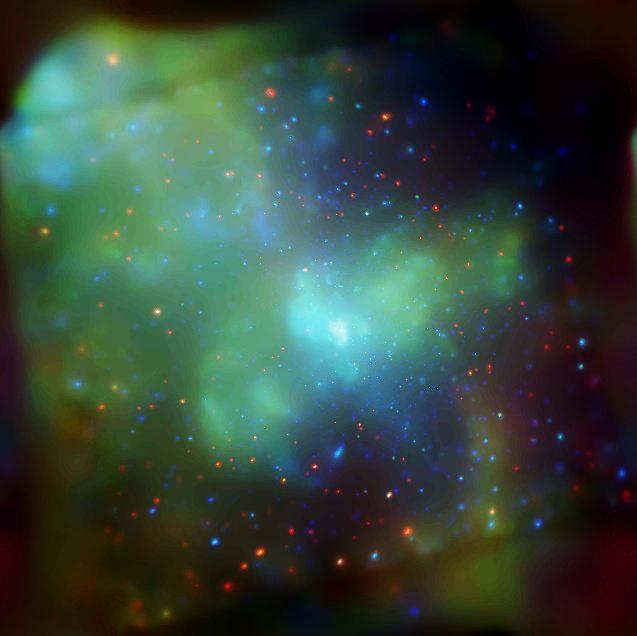
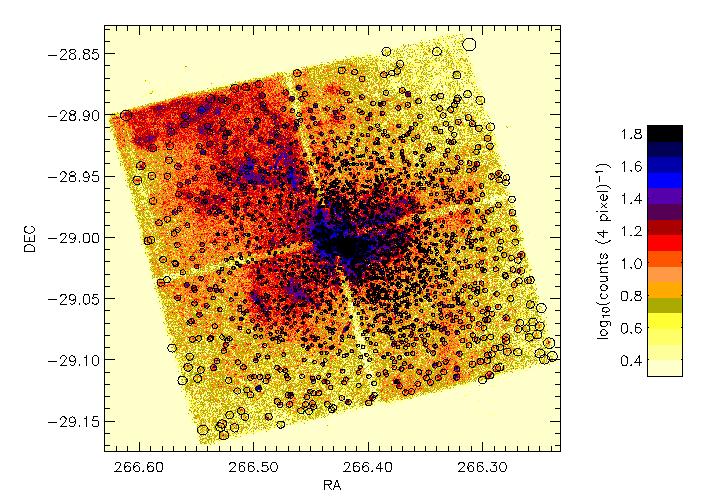
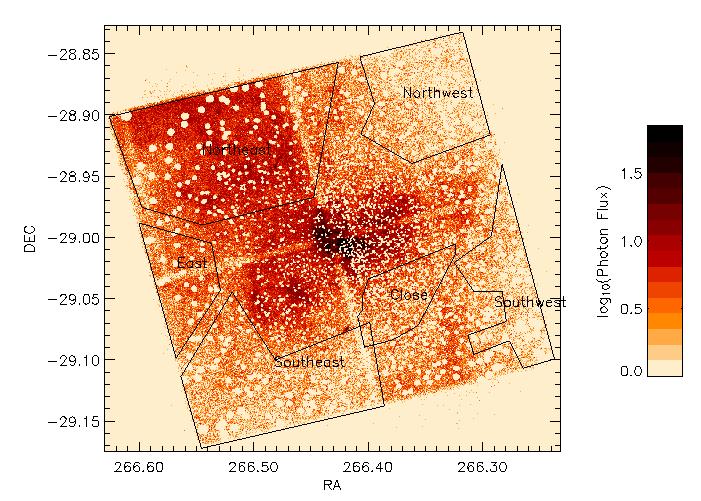
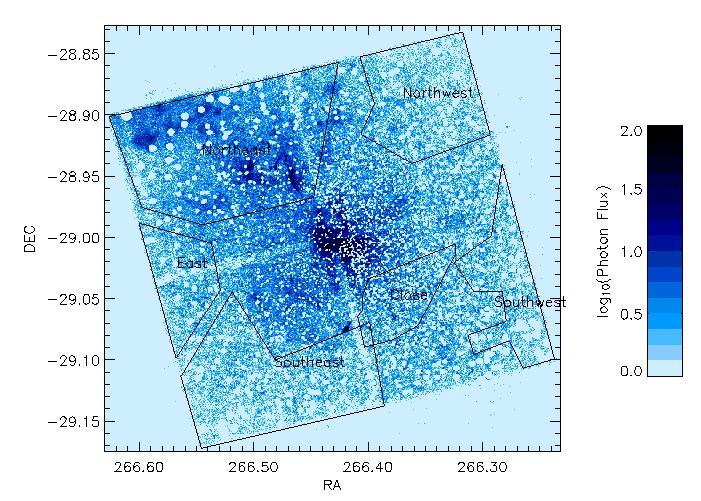
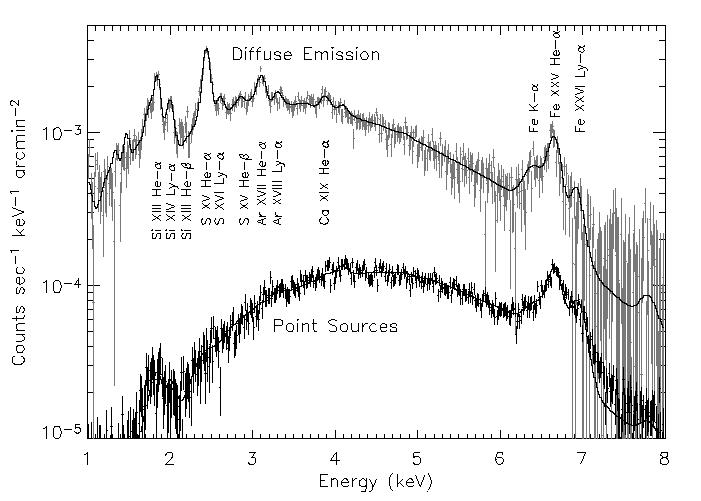
The raw event lists from each observation were processed and combined as described in Muno et al. (2003a). The resulting raw image is displayed in Figure 1, while a smoothed three-color image is presented in Figure 2. We identified 2353 point sources in this image using a wavelet-decomposition algorithm (wavdetect), and extracted spectra for groups of sources based on their intensity and spectrum. Next, we isolated the diffuse emission, using the mask illustrated by the circles in Figure 1 to remove the point sources. Figures 3 and 4 display the resulting images in the 2-4 keV and 4-8 keV bands, respectively. The spectra of the diffuse emission were extracted from the regions indicated in these figures. Representative spectra of the diffuse emission and point sources are displayed in Figure 5.
We modeled the spectra of the point sources and the diffuse emission using a standard least-chi2 fitting package (XSPEC). We assumed the diffuse emission was produced by two thermal plasma components (the model vapec) and a Gaussian line to account for low-ionization Fe K- alpha emission at 6.4 keV. We allowed the abundances of Si, S, Ar, Ca, and Fe in the plasma model to vary independently, although we applied the same values to each component. We assumed that each plasma was absorbed by a different column of gas, which was modeled as (1) a uniform absorber that applied to the entire image plus (2) a partial-covering absorber that applied to a fraction f of the image. We will report the detailed results of the modeling in up-coming publications, so we only summarize them below.
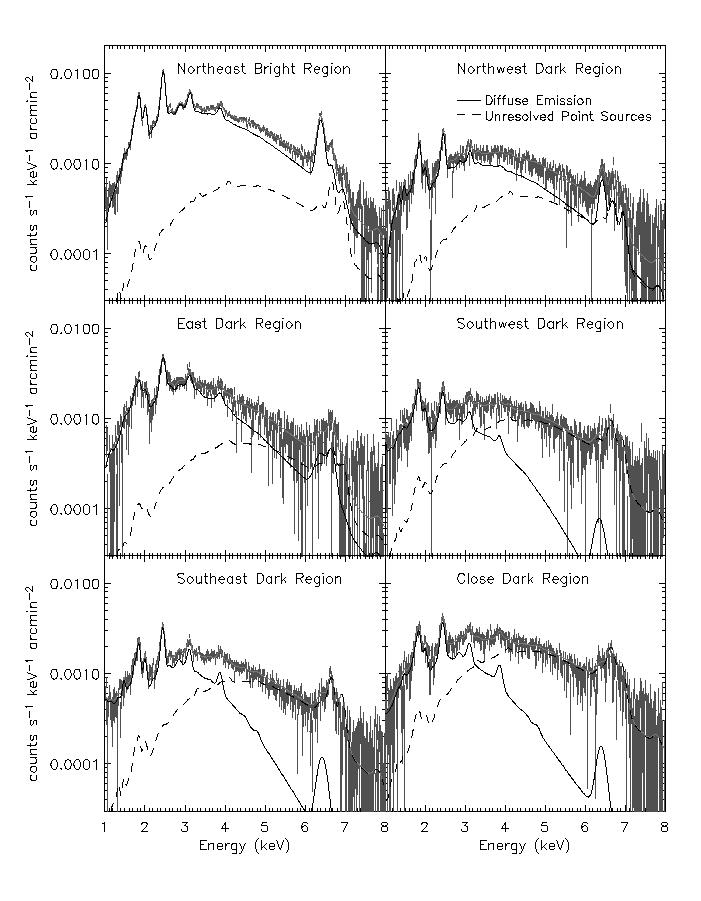
The hard component of the diffuse emission is most important to the current study, because its spectrum closely resembles that of the point sources in Figure 5. The surface brightness of the hard component varies by a factor of two across the image, from 1.5*10-13 erg cm-2s-1arcmin-2 in the darkest region to 2.6*10-13 erg cm-2s-1arcmin-2 in the Northeast (Figure 4). The inferred temperature of the plasma varies between 6-9 keV, because there are significant variations in the equivalent widths and flux ratios of the He-like and H-like iron lines.
The properties of the soft component represent a bit of a tangent. Its surface brightness is highest by far in the Northeast region, where the hard emission is also most intense (see Figure 3). This suggests that production mechanisms for the two plasma components are related.
In order to establish a fiducial spectrum for the unresolved point sources, we examined the spectra of the resolved sources as a function of their intensity. We selected only those sources which were not detected below 1.5 keV, as these are most likely to lie near the Galactic center. We found that the averaged spectra varied very little. The only significant trends were that as the point sources considered became fainter (1) the He-like Fe emission at 6.7 and 6.9 keV increased in intensity, while (2) the low-ionization Fe emission at 6.4 keV decreased in intensity. Therefore, for our fiducial point-source spectrum we used the faintest sources, those with fewer than 80 net counts.
We also note that, in contrast to the diffuse emission, the flux from resolved point sources in nearly constant at any given offset from Sgr A*. The fluxes from resolved point sources in each region are listed in Table 1.
Table 1
| Southeast | Southwest | Northwest | East | Close | Northeast | |
|---|---|---|---|---|---|---|
| Ftot | 1.80 | 1.84 | 1.72 | 2.27 | 3.02 | 4.49 |
| Fresolved | 0.2 | 0.3 | 0.2 | 0.2 | 1.0 | 0.4 |
| F1 | 0.26 | 0.17 | 0.20 | 0.62 | 0.36 | 1.83 |
| F2 | 1.47 | 1.64 | 1.53 | 1.63 | 2.48 | 2.64 |
| F1 | 0.49 | 0.02 | 0.23 | 0.52 | 0.54 | 1.68 |
| F2 | 0.04 | 0.37 | 0.81 | 0.91 | 0.06 | 1.93 |
| Funresolved | 1.27 | 1.46 | 0.68 | 0.84 | 2.42 | 0.87 |
The surface brightness of the diffuse emission that can be accounted for by unresolved point sources is listed by region in Table 1, and is displayed graphically in Figure 6. Unresolved point sources may produce (0.7-1.5)*10-13 erg cm-2s-1arcmin-2 in the regions 7' from the Galactic center, which is 35-80% of the total observed diffuse flux. We also list in Table 1 the flux from the soft and hard components that remains when an unresolved point source contribution is included. The reduction in the inferred diffuse flux is most dramatic in the hard band. Nevertheless, including a point source contribution in the Northeast, Northwest, and East does not removed the need for an 8 keV plasma component.
The significant differences between the upper limits to the unresolved point source contribution in each region occur because the fluxes and ratios of the fluxes in the He-like and H-like Fe lines are spatially variable (Figure 6), and they match the spectra of the point sources better in some regions than in others. Since the surface brightness from resolved point sources is relatively constant from field-to-field in the dark regions (Table 1), it seems unlikely that the surface brightness of unresolved point sources at the Galactic center actually varies from field-to-field by a factor of two. It is equally unlikely that the average spectra from hundreds of point sources varies on arcminute scales. Therefore, the most reasonable upper limit to the unresolved flux from point sources is the lowest inferred value: 7*10-14 erg cm-2s-1arcmin-2 in the Northwest dark region.
We can use this value and the log(N)-log(S) distribution from Equation 5 in Muno et al. (2003a) to compute an upper limit to the surface density of unresolved point sources near the Galactic center. We find that the total point-source flux in the Northwest region of Figure 2 could be produced by the integrated flux from sources brighter than Smin=4*10-16 erg cm-2s-1. This is only a factor of ten lower than the completeness limit of Muno et al. (2003a), and it corresponds to a luminosity of 3*1030 erg s-1 at 8 kpc. Moreover, this flux limit implies that there are 95 sources arcmin-2 at an offset from Sgr A* of theta=8', which is 40 times higher than the number of sources resolved there by Muno et al. (2003a). Since the surface density of point sources increases as theta -1 toward Sgr A*, there could be as many as 750 sources arcmin-2 within 1' of Sgr A*.
On the other hand, unresolved point sources can not produce all of the hard diffuse emission from the Galactic center, and so its origin is therefore still an open question. The 0.8 keV plasma is probably produced by supernova, which are the largest heating source for the ISM. Indeed, 1 keV plasma is commonly inferred to be present in supernova remnants, and the energy required to heat the plasma is only fraction of the kinetic energy known to be released by supernova. In contrast, supernova rarely produce plasma with kT > 3 keV (Kaneda et al. 1997). Therefore, the hard diffuse emission has been variously modeled as originating from plasma heated and confined by magnetic filaments (Tanuma et al. 1999), quasi-thermal plasma continuously accelerated by shocks in the 0.8 keV plasma (Dogiel et al. 2002; Masai et al. 2002), and emission from cosmic-ray electrons (Valinia et al. 2000). These mechanisms are not entirely satisfying yet, because they all require significant assumptions about processes for which we have few other observational constraints (see the discussion in, e.g. Dogiel et al. 2002).
Further progress in understanding the origin of the diffuse X-ray emission from the Galactic plane awaits observations with much higher energy resolution. The major predictions of the quasi-thermal plasma and cosmic-ray models are that the line strengths and ratios in the diffuse emission should differ significantly from their collisional-equilibrium values (Valinia et al. 2000; Masai et al. 2002). Unfortunately, the current Chandra observations appear unable to distinguish these from variations in the elemental abundances. ASTRO-E 2 will have a factor of 10 better energy resolution than ACIS-I on Chandra, which will enable us to resolve the He-like n=2-1 triplet from Fe, and to detect radiative recombination continua from Si, S, Ar, and Fe. Therefore, the prospects for understanding the source of the hard diffuse X-ray emission within the next decade are excellent.
References
| Editors of this Volume: | Angela Cotera | Sera Markoff | Loránt Sjouwerman |
| SETI Institute | MIT Center for Space Research | National Radio Astronomy Observatory | |
| cotera@asu.edu | sera@space.mit.edu | lsjouwerman@aoc.nrao.edu |