Article - GCNEWS, Vol. 15, July 2002

 GCNEWS
A Newsletter for Galactic Center Research
This Volume was edited by Angela Cotera, Heino Falcke & Sera Markoff
email: gcnews@aoc.nrao.edu

Volume 15, July 2002
- ARTICLE
[Home]
[New Abstracts]
[Newsletter]
[Newsflash]
[Articles]
[Conferences]
[Subscribers]
[Subscription]
[Submission]
[Next page]
[Previous page]
[Cover page]
For a PostScript version of the article click here.
Sub-Millimeter Array Observations of Sagittarius A*: Flares at 1 Millimeter Wavelength
Jun-Hui Zhao
(60 Garden St., MS 78, Cambridge, MA 01720 USA; jzhao@cfa.harvard.edu)
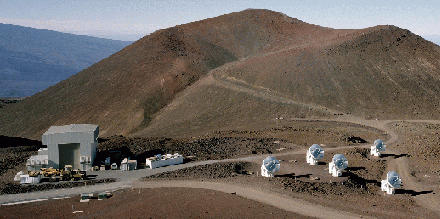
Figure 1:
The partially completed Sub-Millimeter Array (SMA)
on Mauna Kea, Hawaii. The SMA is a collaborative project of
Smithsonian Astrophysical Observatory and the Institute of Astronomy
and Astrophysics of the Academia Sinica of Taiwan (Moran 1998). The
SMA has been used to monitor Sgr A* at high frequencies as described
in the invited article in this issue (see Article by Jun-Hui Zhao).
Click here for a PostScript version of the figure.
Abstract
We summarize the results from recent observations of Sgr A* at
short-/sub-millimeter wavelengths made with the partially finished
Sub-Millimeter Array (SMA) on Mauna Kea. A total of 25 epochs of
observations were carried out over the past 15 months. Noticeable
variations in flux density at lambda 1.3 mm were observed showing
three ''flares''. The SMA observations suggest that Sgr A* is highly
pulsed towards the submillimeter wavelengths during a flare suggesting
the presence of a break wavelength around lambda 3
mm. Cross-correlations of the SMA data at lambda 1 mm with the lambda
1 cm data obtained with the VLA show negative lags, suggesting that
sub-millimeter wavelengths tend to peak first. The SMA observations
indicate that Sgr A* is constantly powered by the central engine but
the flaring plasma might well be confined within the characteristic
radius ( 40 Rsc) at lambda 3 mm. The SMA data appears to
provide unique, important information for understanding the puzzling
phenomenon of Sgr A*. The trial observations of Sgr A* have
demonstrated that the SMA is a powerful telescope for studying the
nature of accretion flows, possible outflows and their immediate
environments surrounding a supermassive black hole.
Introduction
Sgr A*, a compact radio source, is believed to be associated with the
supermassive black hole at the Galactic center (Eckart & Genzel
1997; Ghez et al., 1998). The inferred bolometric luminosity (L ~
10-8.5 LEdd) is far below the Eddington luminosity
assuming that the mass of the black hole is M = 2.6*106
Mo hereafter. Sgr A* represents an extremely dim
AGN. Because of its compactness, we have known little about its
intrinsic structure. The apparent structure at radio wavelengths up to
lambda 3 mm appears to be mainly dominated by the scattering structure
due to the ISM. Its intrinsic size measured at lambda 3 mm is less
than 0.27 mas (Doeleman et al. 2001) suggesting that a characteristic
source size at lambda 3 mm is 40 Schwarzschild radii (Rsc hereafter).
The compactness of the source appears to be just beyond our current
capability to image its detailed structure using the available
telescopes. Alternatively, a promising way to explore this extremely
compact source is to monitor the variations of the emitting flux
density at multi-wavelengths from radio to X-ray.
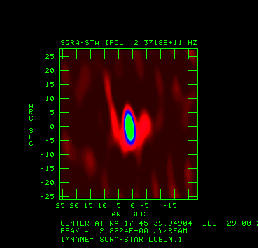 Figure 2:A false-color image of Sgr A* (blue) and its
vicinity (red) made from 3.5 hr observations using the four elements
of the partially finished SMA on May 23, 2002. The total integration
time on the source is about 1.5 hr. The r.m.s.
noise is 30 mJy/beam. The FWHM beam is 7.4'' x 2.3''
(P.A. = 7 DEG). (Click here for a PostScript version.)
Figure 2:A false-color image of Sgr A* (blue) and its
vicinity (red) made from 3.5 hr observations using the four elements
of the partially finished SMA on May 23, 2002. The total integration
time on the source is about 1.5 hr. The r.m.s.
noise is 30 mJy/beam. The FWHM beam is 7.4'' x 2.3''
(P.A. = 7 DEG). (Click here for a PostScript version.)
The variations in radio flux density of Sgr A* have been known for two
decades (Brown & Lo 1982). The nature of the radio variability has
not been well understood. At the long wavelengths, the flux density of
Sgr A* might be modulated by the scintillation due to the turbulence
in the ISM (Zhao et al. 1989).
The radio light curves observed with the VLA at wavelengths from
lambda 20 to 1.3 cm during the period of 1990-1993 suggests that the
amplitude variations increased towards short wavelengths and that the
rate of radio flares appeared to be about three per year (Zhao et
al. 1992; and Zhao & Goss 1993). The typical time scale of these
radio flares is about a month. The observed large amplitude
variations in flux densities at lambda 3 mm (Wright & Backer 1993;
Tsuboi, Miyazaki and Tsutsumi 1999) are consistent with the
wavelength-dependent train of the fluctuation amplitude as observed at
centimeter wavelengths. Based on the radio-monitoring data obtained
with the 3.5 km Green Bank Interferometer (GBI) at lambda 11 and 3.6
cm, a characteristic time scale of 50-200 days was derived at both
wavelengths and the structure function of lambda 11 cm data suggested
a quasi-periodic variation with a period of 57 days (Falcke 1999).
A presence of a 106 day cycle in the radio variability of Sgr A* was
revealed based on an analysis of data observed with the VLA in the
period of 1977-1999 (Zhao, Bower and Goss 2001). The periodic
oscillation at a period around 100 days appears to be persist in the
densely sampled light curves obtained with the VLA at lambda 2, 1.3
and 0.,7 cm over the past two years (McGary et al. 2002). The period
of the cycle appears to increase to 130 days suggesting a
quasi-periodic nature of the variability in radio flux density (Bower
et al. 2002; Zhao et al. 2002). In addition, a low frequency
oscillation feature is also revealed (Zhao et al. 2002).
A monitoring program at lambda 2 and 3 mm was carried out with the
Nobeyama Millimeter Array (NMA) and several flares were observed in
the period of 1996 to 2001 (Tsutsumi et al. 2002). The folded light
curve of their lambda 2 to 3 mm data with a module of 100-120 days
shows that the flaring phase can be separated from that of the
quiescent state. The NMA data provides additional evidence for a
quasi-periodic fluctuation of the flux density at millimeter
wavelengths.
The radio variabilities are likely to be associated with the
activities occurring in the accretion region around the supermassive
black hole. Observations at wavelengths from short- to sub-millimeters
can penetrate into the deep region of this intriguing source. Critical
information about inner accretion region near the black hole can be
obtained by decoding the light curves.
Good news is that the Sub-Millimeter Array (SMA) is now coming on line
(see Fig. 1). With this powerful sub-millimeter array (Moran 1998),
we have started a trial program in monitoring Sgr A* at short- to
sub-millimeter wavelengths. In this article, we summarize the
preliminary results obtained from the SMA observations of Sgr A*.
Observations and Calibrations
The observations of Sgr A* at lambda 1.3 mm and 0.87 mm were done
using the partially completed SMA with three or four antennas ranging
the baselines from 7 to 55 kilo wavelengths at lambda 1.3 mm. A total
of 25 epochs of observations were made in reasonable good weather
conditions (the atmospheric opacity less than 0.3 at lambda 1.3
mm). The observations were carried out with a total bandwidth of 328
MHz for each sideband. A typical r.m.s. noise of 20 mJy can be
achieved from an observation with four antennas for an on-source
integration time of 2 hrs. The sensitivity of the partially completed
SMA is already adequate for monitoring a variable source in a flux
density >1 Jy at lambda 1.3 mm. In each epoch of observation, the
flux density scale was determined by observing a compact planet
(Neptune and Uranus). Sgr B2-north ( 50 Jy at lambda 1.3 mm) was used
to check the fringe and the first order of absolute flux density
calibration. Further calibration was done by observing two nearby
QSOs, OV236 and NRAO 530. The systematic errors, such as errors due to
a poor pointing model, were corrected and minimized in the calibration
process.
In addition, Sgr A* is located in the complex, extended source Sgr A West.
Based on the SMA image (Fig. 2), we find that,
for baselines 20k lambda or longer, Sgr A* is dominant in the
correlated flux density and the confusing flux density at lambda 1 mm
from the surrounding free-free and dust emission is less than 0.3 Jy.
The flux density measurements were done initially in the visibility
domain and were then double checked by constructing images using the
visibility data. The typical uncertainty at lambda 1 mm is in a range
of 10 to 20%.
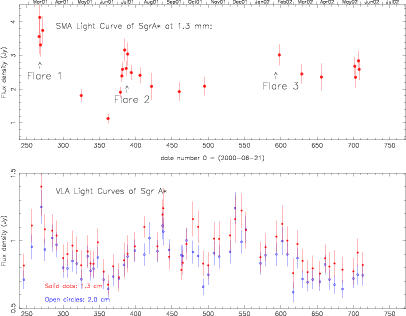 Figure 3:The SMA light curve at lambda 1.3 mm observed in the period between
March 2001 and May 2002 (upper panel). In the same period, the densely sampled
radio light curves at lambda 1.3 and 2 cm were observed with the VLA (lower panel,
McGary 2002). (Click here for a PostScript version.)
Figure 3:The SMA light curve at lambda 1.3 mm observed in the period between
March 2001 and May 2002 (upper panel). In the same period, the densely sampled
radio light curves at lambda 1.3 and 2 cm were observed with the VLA (lower panel,
McGary 2002). (Click here for a PostScript version.)
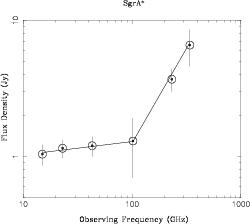 Figure 4: A spectrum of Sgr A* made from the observations near the
peak of Flare 1. The lambda 0.87 and 1.3 mm measurements were made with the SMA.
The measurements at lambda 3 mm were obtained from Nobeyama observations (Tsutsumi
et al. 2002). The data at lambda 0.7, 1.3 and 2 cm were from McGary et al. (2002).
(Click here for a PostScript version.)
Figure 4: A spectrum of Sgr A* made from the observations near the
peak of Flare 1. The lambda 0.87 and 1.3 mm measurements were made with the SMA.
The measurements at lambda 3 mm were obtained from Nobeyama observations (Tsutsumi
et al. 2002). The data at lambda 0.7, 1.3 and 2 cm were from McGary et al. (2002).
(Click here for a PostScript version.)
Results
Light Curve and Flares
Fig. 3 shows the SMA light curve at lambda 1.3 mm suggesting that Sgr
A* varies significantly. The light curve of Sgr A* appears to be
characterized with a few ''flares'' while the calibrators show secular
variation with opposite drifts in flux density over the past year.
Three ''flares'' were observed over a 1-year period. Both the
2001-March and 2002-February flares (Flare 1 and Flare 3 as marked in
Fig. 3) were partially observed in their dropping phase while the
2001-July flare (Flare 2) was observed covering its entire cycle from
its rising to maximum and then a slow decrease. Flare 1 (started from
4.1+/-0.5 Jy after an unseen peak and decreased to 1.1 +/- 0.15 Jy in
three months) appeared to be relatively stronger than others. The
rising time in Flare 2 took about 2 weeks, reaching a peak of
3.2 +/- 0.3 Jy on July 10, 2001. Then, a slow decrease lasted about 3
months. Then we were not able to observe Sgr A* for next 3 months for
the solar avoidance restricted by the current SMA system. The
monitoring program was resumed in early February 2002. A tail of a
possible flare (Flare 3) appeared to be observed in early 2002.
In addition, we checked variations in short time scales and found no
evidence for significant variations (2
[Smax-Smin]/[Smax+Smin] <
40%) in a time scale of 1 hr.
Spectrum during A ''Flare''
We also observed Sgr A* at lambda 0.87 mm with the SMA on March 22,
2001. We made the first measurement of Sgr A* (Slambda =
0.87 mm = 6.7 +/- 1.5 Jy) at the sub-millimeter band using the
three-element array of the partially completed SMA. Fig. 4 shows a
spectrum derived from the mean flux density observed near the peak of
Flare 1. The spectrum suggests a break frequency at 100 GHz (or a
break wavelength at lambda 3 mm). The spectral index is about
0.1 +/- 0.1 below 100 GHz, and 1.4 +/- 0.4 above 100 GHz. The intensity of
the flare appeared to be highly pulsed towards sub-millimeter
wavelengths. A flux density excess at sub-millimeter wavelengths has
been observed (Zylka, Mezger, & Lesch 1992; Serabyn et al. 1997;
Falcke et al. 1998). The flare spectrum shows a large excess in flux
density at sub-millimeter wavelengths, suggesting that flares at
sub-millimeter are more prominent.
Correlation with The VLA Data
The SMA data at lambda 1 mm appears to show a correlation with the
light curves observed with the VLA. The SMA light curve presented
about three ''flares'' from Sgr A* in the past year. Based on the
sparsely sampled data points from the SMA observations alone, one can
not make any conclusive confirmation on the quasi-periodic
fluctuations in flux density. The existing SMA light curve is
suggestive. Considering the nature of the ''flares'' with a strong
pulsing intensity towards sub-millimeter wavelengths, studying the
variability of Sgr A* is an excellent scientific project to the newly
built SMA. On the other hand, the excellent site condition on Mauna
Kea, the angular resolution and the sensitivity of the array, the SMA
is an important telescope for solving the puzzling nature of Sgr A*.
With available data obtained with the SMA during the past year, we are
now able to derive some interesting results from a cross-correlation
analysis of the SMA data with the VLA data at lambda 1 cm. Because of
the large ''sampling gaps'' in the SMA light curve, we are still
seeking for an effective tool to derive a global cross-correlation
properties of the light curves. Meanwhile, we can break the light
curves into three ''flaring'' segments (see Fig. 5). Cross-correlation
analysis suggests that the SMA data at lambda 1 mm in all the three
segments tend to have negative lags with respective to the VLA data at
lambda 1 cm although there is a large uncertainty in the lags for
Flares 1 and Flare 3 due to their unseen peaks. Flare 2 does show a
significant lag (tlag = -24 +/- 8 days).
There appears to be a tendency that the flares at lambda 1 mm peak
first and the delay time at lambda 1 cm seems to be proportional to
the intensity of the flares.
The tendency of short wavelength flaring first is also suggested by
the increase of lags towards long wavelength based on an analysis of
the the new VLA data at lambda 2, 1.3 and 0.7 cm (Bower et al. 2002).
In addition, the strong X-ray flare of time scale of 1 hr observed by
Baganoff et al. (2001) was about 10 days earlier than a radio peak
observed in all three VLA monitoring bands. During Flare 2 (July
2001), Chandra observed Sgr A* on July 14, 2001, a few days past the
lambda 1 mm peak, showing no X-ray flares. The X-ray flux level was
consistent with that of a quiescent state (Baganoff 2001, private
communication).
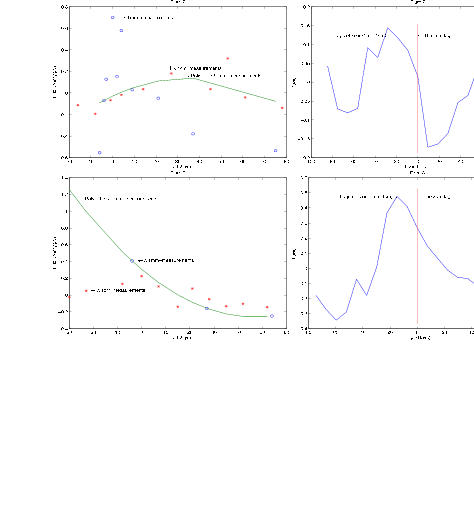 Figure 5:
The left panels are the segmental light curves at lambda 1.3 mm (open
circles) and lambda 1.3 cm (asterisks) of each observed ''flares''
(Flare 1, Flare 2, and Flare 3). The right panels are the
cross-correlations (blue curve) of the SMA data at lambda 1.3 mm with
the VLA data at lambda 1.3 cm. The vertical red line marks the zero
lag. The lags are tlag(Flare 1) -14 d,
tlag(Flare 2) = -24 +/-8 d, and tlag(Flare 3)
-15 d. (Click here for a PostScript
version.)
Figure 5:
The left panels are the segmental light curves at lambda 1.3 mm (open
circles) and lambda 1.3 cm (asterisks) of each observed ''flares''
(Flare 1, Flare 2, and Flare 3). The right panels are the
cross-correlations (blue curve) of the SMA data at lambda 1.3 mm with
the VLA data at lambda 1.3 cm. The vertical red line marks the zero
lag. The lags are tlag(Flare 1) -14 d,
tlag(Flare 2) = -24 +/-8 d, and tlag(Flare 3)
-15 d. (Click here for a PostScript
version.)
Discussion & Summary
The SMA observations have shown that Sgr A* varies significantly at
lambda 1 mm during the course of SMA monitoring in the past year. The
derived lags from a cross-correlation analysis appear to be good
evidence for that the flaring component is inside out starting from
short wavelengths and then passing to long wavelengths. A recent work
by Yuan, Markoff & Falcke (2002) provides a way to link a jet
outflow (e.g. Falcke et al. 1993) with the ADAF (Narayan et al. 1998).
The Jet-ADAF model appears to fit reasonably well to the overall
spectrum of Sgr A* from radio, sub-millimeter, IR to the X-ray. In the
Jet-ADAF model, the sub-millimeter excess is thought to be a result
from a sum of the synchrotron radiation from both the ADAF and the
nozzle of the jet.
On the other hand, from the observations with SMA and other
interferometer arrays, further constraints on the models are
discussed. Taking a mean delay time of 2 weeks and the source size of
40 Rsc, an expansion velocity, vexp ~ 200 km
s-1 or < 0.001 c, is inferred. The specific kinetic energy
(1/2 vexp2 ~ 5*10-7 c2) in
the outward bulk motion of the flaring plasma appears to be far below
the gravitational potential energy ([GM/r]r=40
Rsc ~ 0.01 c2) within the radius of 40
Rsc or the characteristic surface at lambda 3 mm. The bulk
kinetic energy appears to be too small to power a noticeable jet in
Sgr A*. In addition, the break wavelength around lambda 3 mm also
indicates that a large fraction of the flaring plasma might well be
confined within the characteristic radius at lambda 3 mm although the
possible outflow tends to expand to a larger scale.
The sparse SMA data is not sufficient to confirm the
periodic/quasi-periodic fluctuation in flux density around lambda 1
cm. The observed outburst rate ( 3 times in a year) is consistent
with that Sgr A* has been being regularly powered by the central
engine.
The time scale (weeks) of lambda 1 mm flares differs from the time
scale (1 hr) of the X-ray flare (Baganoff, 2001). The fact of a lack
of strong flares in a short time scale at lambda 1 mm places a
critical constraint on the hypothesis of the inverse Compton
scattering as the emission mechanism for the short lived X-ray
flares. Alternatively, the flares at sub-millimeter wavelengths might
be a result of collective mass ejections associated with the X-ray
flares.
Finally, the data obtained from the SMA monitoring program are
critical to our diagnosis of the Sgr A* phenomenon and therefore to
our understanding the accretion process and the active environment
around a supermassive black hole in a low luminosity AGN.
I would like to thank the SMA staff from both SAO and ASIAA for
supporting this monitoring program. In particular, I am very grateful
to Ken (Taco) Young for his help and efforts in acquiring the SMA
data.
References
- Baganoff, F. K., Bautz, M. W. et al., 2001, Nature 413, 45
- Bower, G. C., McGary, R. S., Zhao, J.-H., & Goss, W. M., 2002, AAS Meeting 199, \#85.08
- Brown, R. L. & Lo, K. Y., 1982, ApJ, 253, 108
- Doeleman, S. & Shen, Z., Rogers, A.E.E., et al., 2001, AJ, 121, 2610
- Eckart, A., & Genzel, R., 1997, MNRAS, 284, 576
- Falcke, H., Mannheim, K., & Biermann, P. L. 1993, A &A, 278, L1
- Falcke, H., Goss, W. M., Matsuo, H., Teuben, P., Zhao, J.-H., & Zylka, R., 1998, ApJ, 499, 731
- Falcke, H., 1999, in ASP Conf. Ser. 186: The Central Parsecs of the Galaxy, ed. H. Falcke, A. Cotera,
W. J. Duschl, F. Melia, and M.J. Rieke (San Francisco: Astronomical Society of the Pacific), p. 113
- Ghez, A. M., Klein, B. L., Morris, M., and Becklin, E. E., 1998, ApJ, 509, 678
- McGary, R. et al., 2002, in preparation
- Moran, J. M., 1998, in Proc. SPIE, Vol. 3357: Advanced Technology MMW, Radio & Terahertz Telescopes,
ed. Thomas, G. Phillips, p. 208
- Narayan, R., Mahadevan, R., Grindly, J. E., Popham, R., & Cammie, C., 1998, ApJ, 492, 554
- Tsuboi, M., Miyazaki, A. & Tsutsumi, T., 1999, ASP Conf. Series 186, p105
- Tsutsumi, T., Miyazaki, A. & Tsuboi, M., 2002, AAS Meeting 200, \#44.09
- Serabyn, E., Carlstrom, J., Lay. O., Lis, D. C., Hunter, T. R., & Lacy, J. H., 1997, ApJ, 490, L77
- Wright, M. and Backer, D. C., 1993, ApJ, 417, 560
- Yuan, F., Markoff, S., & Falcke, H., 2002, A &A, 383, 854
- Zhao, J.-H., Ekers, R. D., Goss, W. M., K. Y. Lo & Narayan R., 1989, IAU Symp. 136, 535.
- Zhao, J.-H., Goss, W. M., Lo, K. Y. and Ekers, R. D., 1992, ASP Conf. Series 31, 295
- Zhao, J.-H. and Goss, W. M. 1993 Sub-arcsecond Radio Astronomy, R. J. Davis and R. S. Booth,
Cambridge University Press, 38
- Zhao, J.-H., Bower, G. C., Goss, W. M., 2001, ApJ, 547, L29
- Zhao, J.-H., et al., 2002, in preparation
- Zylka, R., Mezger, P. G., & Lesch, H., 1992, A &A, 261, 119
[Next page]
[Home]
[New Abstracts]
[Newsletter]
[Newsflash]
[Articles]
[Conferences]
[Subscribers]
[Subscription]
[Submission]
Credits:
- Editors of this Volume: Angela Cotera, Heino Falcke & Sera Markoff
- The GCNEWS Logo
at the top of this page shows a 20cm radio map of the GC (Sgr A) made by Yusef-Zadeh & Morris.
- The GCNEWS newsletters, newsflashes and web pages are based on scripts originally developed by
Heino Falcke.
- Internet access for GCNEWS is currently sponsored by the
National Radio Astronomy Observatory in Socorro NM/USA.
Page currently maintained by
L. O. Sjouwerman.
File last modified on Thursday 09 October 2003 [10:18 MDT].
[Home]
[New Abstracts]
[Newsletter]
[Newsflash]
[Articles]
[Conferences]
[Subscribers]
[Subscription]
[Submission]