
 GCNEWS
A Newsletter for Galactic Center Research
This Volume was edited by Angela Cotera, Heino Falcke & Sera Markoff
email: gcnews@aoc.nrao.edu
GCNEWS

Frederick K. Baganof
(Center for Space Research, Massachusetts Institute of Technology, Cambridge, MA 02139)
The launch of the Chandra X-ray Observatory in July 1999 has opened a new era in the study of X-ray emission from the Galactic Center. The unprecedented spatial resolution of the High Resolution Mirror Assembly (HRMA) combined with the high efficiency and moderate spectral resolution of the Advanced CCD Imaging Spectrometer (ACIS) on-board Chandra provide, for the first time, the capability of performing sub-arcsecond spectroscopic imaging of X-rays from the Galactic Center in the 0.5-10 keV band. The spatial resolution and accurate astrometry are essential to discriminate emission from Sgr A*, the compact nuclear radio source associated with the supermassive black hole (MBH) at the dynamical center of the Milky Way Galaxy, from X-rays produced in the surrounding compact cluster of massive stars and other hot plasma in the region. Additionally, the sensitivity at medium X-ray energies is essential to penetrate the high interstellar column density along the line-of-sight to the Galactic Center. The ACIS Science Team observed the Galactic Center with Chandra ACIS for 40.3 ks on 21 September 1999. A summary of the major results are provided here (see Baganoff et al. 2001 for more details).
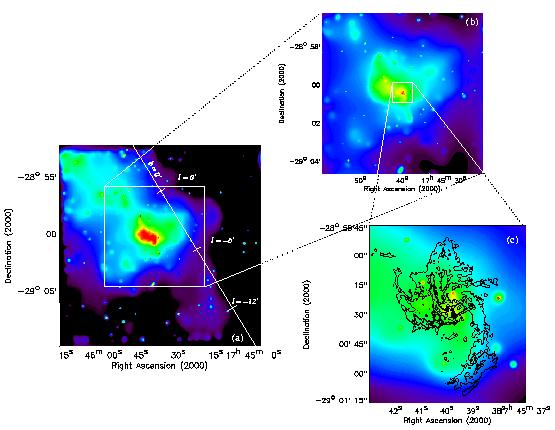
Figure 1 shows an exploded image of the Galactic Center made from the data. Panel (a) is a false-color image of the full 17' * 17' ACIS-I field of view, covering the central 40 pc of the Galaxy. This image and the images in panels (b) and (c) have been adaptively smoothed and flat-fielded to remove mirror vignetting and chip-gap effects and to bring out the structure of the diffuse emission. The Galactic Plane is marked by a white line. The diffuse X-ray emission is strongest in the region filling Sgr A East (red), a shell-like nonthermal radio source thought to be a supernova remnant (Yusef-Zadeh & Morris 1987; Mezger et al. 1989; Maeda et al. 2001). The X-ray continuum and fluorescent-line emission from Sgr A East comes from a hot optically thin thermal plasma (kT 2 keV) that is concentrated in the central 2-3 pc within the 6*9 pc radio shell; no significant X-ray emission is seen from the shell itself. See Maeda et al. (2001) for more details on our Chandra observation of Sgr A East. A curious linear feature 0.5' long (yellow) extends (in projection) from the northeast toward the center of Sgr A East. This feature is superposed within the Sgr A East radio shell. It is clearly present in raw narrow-band images in the 1.5-3 and 3-6 keV bands, but it is not visible in the 6-7 keV band. This is in contrast to the core X-ray emission from Sgr A East, which dominates the 6-7 keV band due to strong Fe-K alpha line emission. Sgr A East sits on a ridge of emission (green & blue) extending north and east parallel to the Galactic Plane that was first seen by Einstein (Watson et al. 1981). This ridge is most sharply defined in the 3-6 keV band, with clumps of bright emission in the 6-7 keV band. Emission extending perpendicular to the Galactic Plane in both directions through the position of Sgr A* is clearly visible (green & blue), as are many of the over 150 point sources detected in the field. This extended X-ray emission corresponds spatially with the so-called Sgr A East ``halo'' in the radio band, but is absent at 6-7 keV and therefore may be unrelated to Sgr A East. Our survey of X-ray sources is complete down to a limiting 2-10 keV absorbed flux of FX 1.7 * 10-14 ergs cm-2 s-1. For sources at the distance of the Galactic Center, the corresponding absorption-corrected luminosity is LX 2.5 * 1032 ergs s-1. The complete flux-limited sample contains 85 sources.
Panel (b) is a false-color, expanded view centered on Sgr A* of the inner 8.4' * 8.4' of the field. Complex structures can be seen in the X-ray emission from the vicinity of Sgr A East (yellow & green). The linear feature discussed above in panel (a) is aligned with a string of clumps or knots (yellow) within Sgr A East, implying that this feature may in fact be physically related to Sgr A East rather than simply a chance superposition on the sky. X-ray emission that we associate with the compact, nonthermal radio source Sgr A* is just discernable in this panel as the southeastern component of the red structure at the center of the image. In addition, there is a clump of bright emission (yellow) centered 0.3 pc east of Sgr A*.
Panel (c) is a false-color, 1.3' * 1.5' close-up around Sgr A* (red dot at 17h45m40.0'', -29o00'28'') overlaid with VLA 6-cm contours showing Sgr A* and Sgr A West (F. Yusef-Zadeh, private communication). X-ray emission coincident with IRS 13 (yellow) is evident just southwest of Sgr A*. The western boundary of the brightest diffuse X-ray emission (green) coincides precisely with the shape of the Western Arc of the thermal radio source Sgr A West. On the eastern side, the emission continues smoothly into the heart of Sgr A East [see red region in panel (a)]. In addition, the indentation seen in the X-ray intensity 25'' southeast of Sgr A* coincides with an HCN emission feature from molecular gas in the circumnuclear disk (CND; see Fig. 3a in Yusef-Zadeh, Melia, & Wardle 2000; and references therein). Since the Western Arc is believed to be the inner edge of the CND, the morpholgical similarities between the X-ray and radio structures strongly suggest that the brightest X-ray emitting plasma is being confined by the western side of the CND. This may be evidence that Sgr A West and Sgr A* physically lie within the hot cavity of the Sgr A East SNR, as has been argued previously based on radio observations.
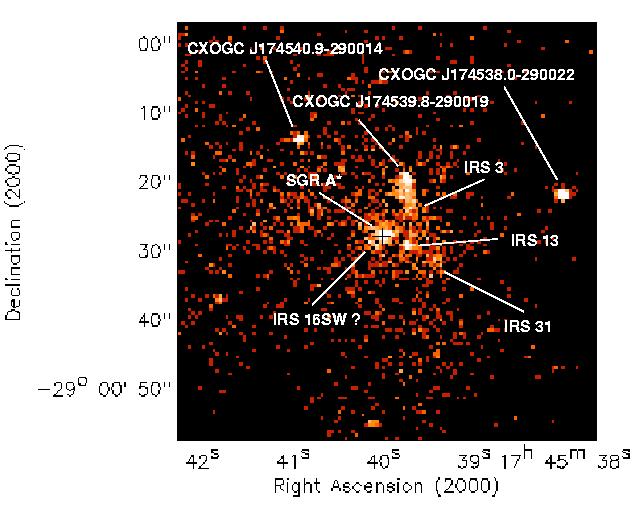
Figure 2 shows a false-color, 1' * 1' field around the position of Sgr A* made from counts in the 0.5-7 keV passband. This image has not been smoothed or flat-fielded. Clearly visible at the center of the image is the source that we associate with Sgr A* based on the extremely close positional coincidence. A black cross marks the radio position of Sgr A* as determined by Yusef-Zadeh, Choate, & Cotton (1999). Sgr A* appears to be sitting on an extended background which peaks locally. Several other X-ray sources lie within 10'' of Sgr A*, and the diffuse emission is also quite prominent (Fx[2-10 keV] 2 * 10-15 ergs cm-2 s-1 arcsec-2). The source to the southwest of Sgr A* matches the radio position of IRS 13 to within 1''. This source coincides with a strong shock at the edge of the ``mini-cavity'' seen in radio and mid-IR images. There is also a hint of excess counts from the vicinity of IRS 16SW, although no source was found there by the Chandra X-ray Center's wavelet source detection algorithm. This is interesting because we have not resolved X-ray emission from the other members of the IRS 16 cluster, which is known to contain a few dozen massive, He I/H I emission-line stars (Najarro et al. 1997). IRS 16SW has been shown to be a He-star binary, suggesting the possibility that we may be seeing X-rays from their colliding stellar winds (Ott, Eckart, & Genzel 1999). Additional observations in the coming years should clarify the situation. The other IRS sources match to within 1-2''.
The X-ray source we have discovered, CXOGC J174540.0-290027, is coincident within 0.''35 +/- 0.''26 (1 sigma ) of the radio source, corresponding to a maximum projected distance of 16 light-days for an assumed distance to the center of the Galaxy of 8.0 kpc. The emission was very weak, LX = (2.4+3.0-0.6) * 1033 ergs s-1 (90% confidence limits) in the 2-10 keV band, after correction for the inferred neutral hydrogen absorption column of NH = (9.8+4.4-3.0) * 1022 cm-2, far below the luminosity limits of previous observatories (see review in Baganoff et al. 2001). The spectrum was relatively soft, with power-law photon index Gamma = 2.7+1.3-0.9 (N(E) propto E-Gamma) or electron thermal energy kTe = 1.9+0.9-0.5 keV, and there was an inconclusive 2.5-3 sigma hint of variability on timescales of an hour. Only a weak (< 2 sigma ) upper limit of 1.8 keV could be placed on the existence of an iron K alpha emission line. The mean count rate in the 2-8 keV band was (5.4 +/- 0.4) * 10-3 counts s-1 (1 sigma ). The source appears to be slightly resolved, with an apparent diameter of 1''.
Based on the fluxes and spatial distribution of the X-ray sources in the field, we estimate that the probability of detecting an absorbed source by random chance that is as bright or brighter than the Sgr A* candidate and that lies within 0.''35 of the radio position is < 5.6 * 10-3. The nearest windy He I/H I emission-line stars are too far away (> 1'') to account for the X-ray source, and other classes of normal stars are too soft to penetrate the high absorbing column. The remaining possible alternatives to the X-ray emission coming from a MBH are quiescent low-mass X-ray binaries (LMXBs), cataclysmic variables (CVs), and isolated neutron stars or stellar-mass black holes. However, the velocity dispersion of stars in the central parsec cluster (100 km s-1) is an order of magnitude larger than in globular clusters. Consequently, binaries in the Galactic Center must have separations that are 100 times smaller. This may make it extremely difficult to create and retain binaries in the inner parsec of the Galaxy. In addition, isolated neutron stars are not particularly massive, so mass segregation may work to exclude them from the core. This still leaves isolated stellar-mass black holes as a possibility; but it is not obvious why one might expect one or more stellar-mass black holes in the vicinity of Sgr A* to radiate X-rays more efficiently than the central 2.6 * 106 Msun black hole.
The inferred mass accretion rate onto the supermassive black hole from the hot ambient medium is \dot M 1 * 10-6 Msun yr-1. Due to the limited Poisson statistics, the observed spectrum cannot discriminate definitively between thermal and nonthermal emission models (e.g., Narayan et al. 1998; Falcke & Markoff 2000; Melia, Liu, & Coker 2001). However, the strongest results (i.e., the low luminosity, soft spectrum, and low accretion rate) appear to favor the synchrotron self-Compton (SSC) models. The SSC models predict the X-ray emission should vary on short timescales and correlate with the submillimeter variability. This prediction will be tested with future, simultaneous Chandra and ground-based radio/submillimeter band observations of Sgr A*.