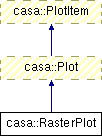
Plot used to show raster (image-like) data. More...
#include <Plot.h>

Public Member Functions | |
| RasterPlot () | |
| virtual | ~RasterPlot () |
| PlotDataPtr | data () const |
| Overrides Plot::data(). | |
| virtual double | valueAt (double x, double y) const |
| Returns the data at the given point. | |
| virtual PlotRasterDataPtr | rasterData () const =0 |
| ABSTRACT METHODS //. | |
| virtual void | setXRange (double from, double to)=0 |
| Sets the x range. | |
| virtual void | setYRange (double from, double to)=0 |
| Sets the y range. | |
| virtual PlotRasterData::Format | dataFormat () const =0 |
| Returns the data format. | |
| virtual void | setDataFormat (PlotRasterData::Format f)=0 |
| Sets the data format. | |
| virtual PlotRasterData::Origin | dataOrigin () const =0 |
| Returns the data origin. | |
| virtual void | setDataOrigin (PlotRasterData::Origin o)=0 |
| Sets the data origin. | |
| virtual vector< double > | contourLines () const =0 |
| Returns the contour line levels, if any. | |
| virtual void | setContourLines (const vector< double > &lines)=0 |
| Sets the contour line levels. | |
Plot used to show raster (image-like) data.
Expected to use PlotRasterData. The line methods in Plot are used for contour lines (if any). A RasterPlot can either use the data values directly as colors, or automatically pick colors based on a range of values and a colorbar. (See PlotRasterData.)
Definition at line 535 of file Plot.h.
| virtual vector<double> casa::RasterPlot::contourLines | ( | ) | const [pure virtual] |
Returns the contour line levels, if any.
| PlotDataPtr casa::RasterPlot::data | ( | ) | const [inline, virtual] |
Overrides Plot::data().
Implements casa::Plot.
Definition at line 543 of file Plot.h.
References rasterData().
Referenced by valueAt().
| virtual PlotRasterData::Format casa::RasterPlot::dataFormat | ( | ) | const [pure virtual] |
Returns the data format.
See PlotRasterData.
| virtual PlotRasterData::Origin casa::RasterPlot::dataOrigin | ( | ) | const [pure virtual] |
Returns the data origin.
See PlotRasterData.
| virtual PlotRasterDataPtr casa::RasterPlot::rasterData | ( | ) | const [pure virtual] |
| virtual void casa::RasterPlot::setContourLines | ( | const vector< double > & | lines | ) | [pure virtual] |
Sets the contour line levels.
| virtual void casa::RasterPlot::setDataFormat | ( | PlotRasterData::Format | f | ) | [pure virtual] |
Sets the data format.
See PlotRasterData.
| virtual void casa::RasterPlot::setDataOrigin | ( | PlotRasterData::Origin | o | ) | [pure virtual] |
Sets the data origin.
See PlotRasterData.
| virtual void casa::RasterPlot::setXRange | ( | double | from, | |
| double | to | |||
| ) | [pure virtual] |
Sets the x range.
| virtual void casa::RasterPlot::setYRange | ( | double | from, | |
| double | to | |||
| ) | [pure virtual] |
Sets the y range.
| virtual double casa::RasterPlot::valueAt | ( | double | x, | |
| double | y | |||
| ) | const [inline, virtual] |
Returns the data at the given point.
Just a thin layer over data functionality.
Definition at line 547 of file Plot.h.
References data(), and rasterData().
 1.6.1
1.6.1