INTRODUCTION TO THE WEB PAGES:
These pages show images and movies related to the observations published in the Astrophysical Journal in Walker, R.C., Hardee, P.E., Davies, F.B., Ly, C., and Junior, W. 2018, Ap. J. 855, 128. The paper should be consulted for discussions of the results and conclusions that can be drawn.
The paper, in various forms, can be also accessed through this ADS link.. Click this link for the preprint at astroph (arXiv). A pdf copy is available here. There are movies included with the paper so it is best to either access the on-line formats at the journal or astroph or look below for copies of the movies.
These web pages were originally written in May 2016 in preparation for the meetings "Blazars through Sharp Multi-wavelength Eyes" held in Malaga, Spain, May/June 2016, which I attended, and "M87 Workshop: Towards the 100th Anniversary of the Discovery of Cosmic Jets" Taipei, Taiwan May 2016, for which I contributed a poster. They have been updated in late December. 2018 in preparation for the Seattle AAS meeting, where I will be giving a poster, to reflect the the content of Walker et al. (2018).
Below are a number of images and movies from the paper plus a
variety of items not in the paper. The latter include varients on the
2007 movie with scrambled image order to help convince the viewer of
the reality of the motions. Also included are movies from the
monitoring in 2006 and 2010 that are not in the paper and animations
made using the contour versions of the 2007 and 2008 images which are
only shown in montages in the paper. All of the movies are shown in
looping animated gifs, although links are given to the mp4 versions
sent to the journal and preprint server.
INTRODUCTION TO VLBI ON M87:
M87 is a dominent galaxy in the VIRGO cluster. It contains a very massive black hole which produces a radio jet and a large radio source. It was the first jet discovered (optically) and has been the target of many investigations. The source is close, at 16.7 Mpc (Bird et al. 2010, A&A 524, A71), compared to most other jet sources. The black hole mass is still controversial, but we use 6.16 billion solar masses (Result of Gebhardt et al. 2011, Ap. J. 729, 119 adjusted for the distance above). Others get a mass about half as great.
With this combination of distance and black hole mass, M87 has the second largest angular size black hole with a known radio source and the largest for a black hole with a jet with significant observable structure. The one larger angular size black hole is SgrA* in our galactic center, but it does not have an obvious jet. For the parameters above, the Schwarzschild radius of the M87 black hole (2GM/c^2) is 7.3 microarcseconds. To put this in perspective, in linear terms, that is 122 times the Earth-Sun distance. A caution - many studies use sizes expressed in units of the gravitational radius which is half of the Schwarzschild ratius.
For high-resolution observations, this Schwarzschild radius is still very hard to reach. To study the general relativistic effects close to the hole, Earth scale baselines at sub-millimeter microwave wavelengths will be required and there are projects, such as the Event Horizon Telescope, that are trying to make such observations possible. Meanwhile, the angular scales of the inner jet are somewhat more accessible. Theoretical studies, especially using numerical modeling, reach distances of 1000 or more Schwarzschild radii. The Very Long Baseline Array ( VLBA) is capable of reaching these scales. The best resolution would be obtained at 86 GHz (3mm wavelength) using the VLBA and other antennas. But such observations are hard to schedule, and present great difficulties for processing, especially for overcoming atmospheric fluctuations. Some have been done and can be found in the literature, but a project of the magnitude of the one reported here would still be difficult at that frequency.
At 43 GHz, the VLBA can achieve a resolution of 430 by 210
microarcseconds elongated at around -16 degrees (higher resolution
east-west than north-south). Those numbers vary with data
distribution and processing parameters, but those are what we have
used as our final CLEAN beams in the images shown here. That resolution
is about 30 by 60 Schwarzschild radii, so we are reaching into the
region covered by the numerical modeling. The hope is to provide some
observational ground-truth against which to test the theories. Somewhat
higher resolution is possible, at a cost of image quality on larger
scales, by varying processing parameters. One such image is below.
THE M87 VLBA MOVIE PROJECT:
This project began with a desire to study the dynamics of the inner M87 jet. On larger scales, superluminal motions are seen. This is a projection effect, seen for many sources, that causes features moving near the speed of light almost toward the observer to appear to be moving faster than the speed of light. To study such motions with the very high linear resolution here, one must observe often enough that features don't move much more than a resolution element between sessions. It was realized in around 2005 that no one was making the observations required for such a study. So this project was proposed and observions began in 2006.
The first observations were a pilot project to try to determine the required cadence. Intervals of 3 days to 3 months were sampled. The results were somewhat confusing, but a cadence of every 3 weeks was selected. Throughout 2007, such observations were made, and resulted in the best movie we have. But it was realized part way through that speeds were being seen that were undersampled - about 2.5 resolution elements per epoch. So, from January to early April in 2008, M87 was observed about every 5 days. Unfortunately, dynamic scheduling on the VLBA, which had been rather effective for the 3 week cadence, did not work very well with a 5 day cadence and only about a 3 day wide window when each session could be done. Thus the image quality of many of the 2008 sessions was not very good, significantly degrading the movie. This is exacerbated by the fact that M87 is sufficiently complex that the data provided even under ideal conditions with a long-track (11 hours) observation is marginal. Any data lost hurts the imaging process.
The 2008 observations provided a significant serendipitous result. Near the start of 2008, there was a flare in M87 at high energies, specifically at the TeV energies studied by the Cherenkov telescopes H.E.S.S, Veritas, and MAGIC. The radio observations showed a significant flare on the core began at about the time of the TeV flare, but lasted much longer. By assuming the radio and TeV flares were related, these observations improved the knowledge of the location of such a TeV flare by many orders of magnitude (Acciari et al. 2008, Science, 325, 447). Unfortunately we did not know about the flares until months later so, extremely uncommon in astronomy, we have observations of the rise of the radio flare but not the fall. We do see the appearance of some new components but did not follow their propagation and presumed acceleration away from the core.
The events of 2008 triggered efforts to find another case of associated TeV and radio flares to help eliminate the possiblility of a chance coincidence. As a result, we have roughly annual "background" sessions, and a series of observations from 2010 when there was a TeV trigger - but no radio flare significantly above the noise and calibration uncertainties. But those observations, along with some existing observations extending the annual sequence back to 1999 have provided material for the study of long term changes in the source.
So, after that somewhat wordy introduction, we can show some
results. Again, for details and discussion, see the Walker et al.
(2018) paper referenced above.
M87 on January 12, 2013
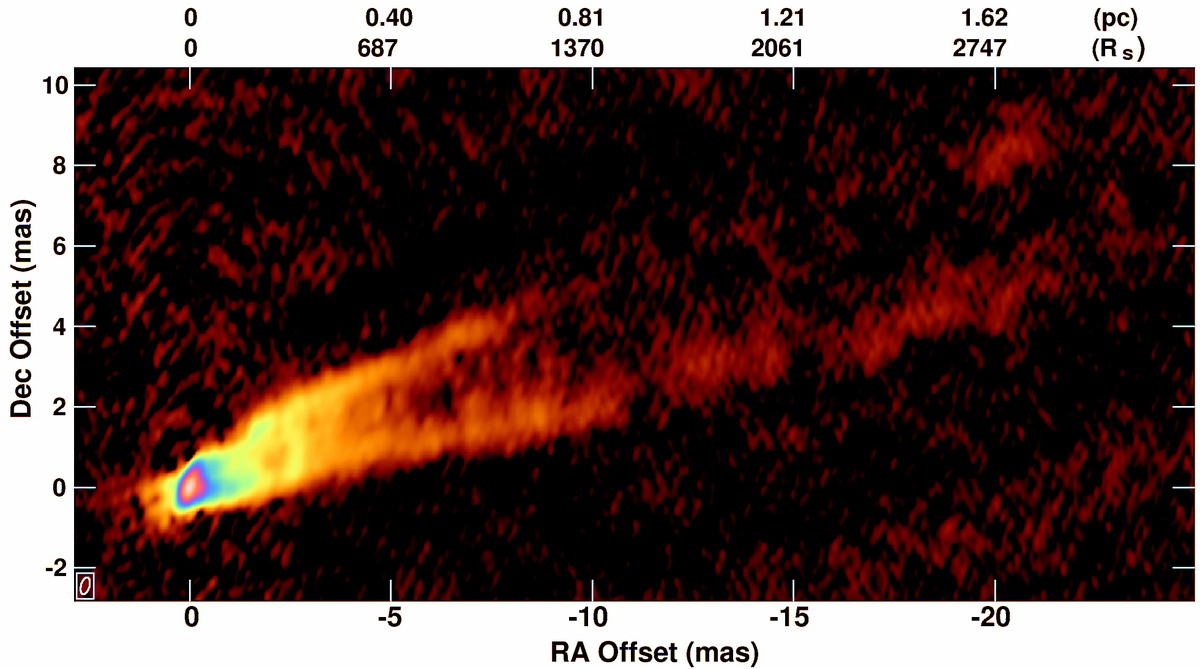
We start with a false color (color representing brightness) image from a
single observation made on Jan. 12, 2013. The peak flux density is
0.62 Jy/beam while the off-source RMS (image noise) is about 62
microJy per beam. That session was the first to use the new,
wider-bandwidth system on the VLBA and had fewer weather and other
issues than the sessions since, so it produced the best images to
date. This image has been annotated across the top with the scales in
parsecs and Schwarzschild radii. Significant features to note are the
wide opening angle of the base of the jet, the strong limb brightening
of the jet, and the presence of a counterjet. Note that the black
hole is thought to be nearly coincident with the brightest feature, at
the coordinate origen.
Average Image of M87: 2007 and 2008 Data
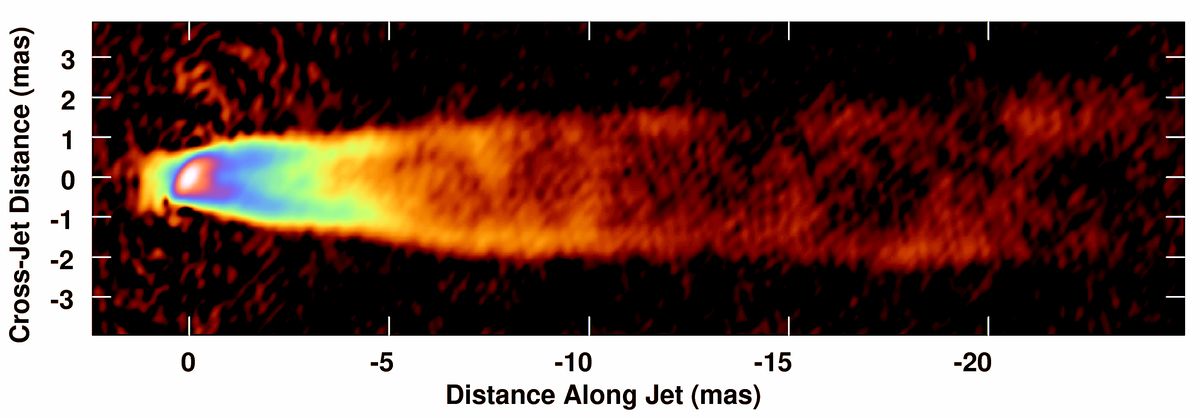
The next image is a "stack", or RMS weighted average, of 24 images
taken during the monitoring in 2007 and 2008. The image has been rotated
by -18 degrees to fit better in horizontal displays. The off-source
noise level is 61 microJy/beam. That this is about the same noise
in the image above shows that the improved VLBA hardware had provided
a very significant performance improvement. Note that, as an average,
the fine scale structure that changes from epoch to epoch is smeared out.
This is much like what happens to a photograph of a waterfall taken with
a long exposure. So the image shows persistent structure but not short
lived fine structures. That can be seen in the the different appearance
of the single epoch image above and the stacks below.
Average Image of M87: 1999 to 2016 Data
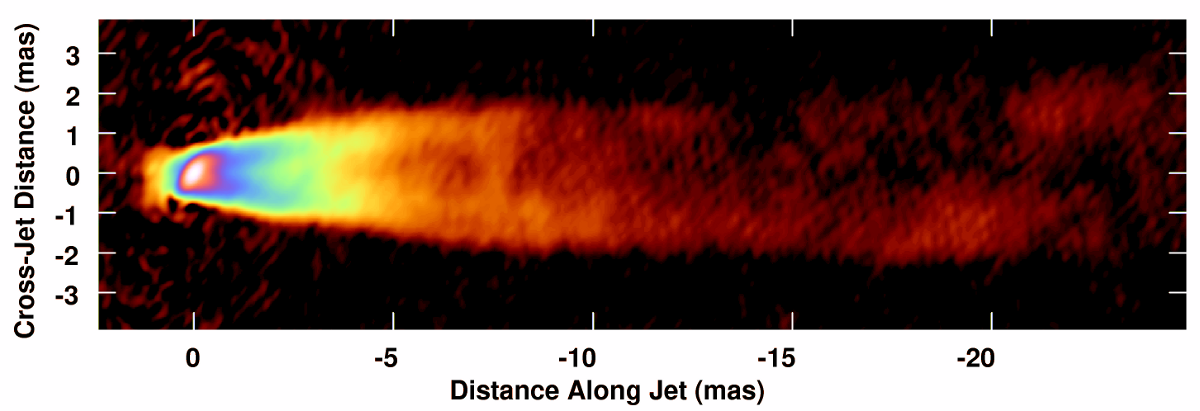
To attempt to achieve the highest signal-to-noise ratio possible,
all of the 49 images available were stacked (noise weighted average)
to produce the image below. The off-source RMS is 47 microJy/beam.
That did not beat down as expected given the quality of the input
images, probably because calibration artifacts are likely to be
similar from epoch to epoch given the similar UV coverage. The image
shows that the bright edges of the source appear broader than they do
in the 2007-2008 stack or in the individual epochs. This is the
result of some side-to-side motions of the jet that will be described
later. Because of this effect, this image was not used in the paper
to study the structure on scales beyond about 2 mas. But it is used
to study the average structure of the counterjet and the jet out to a
distance similar to where the counterjet becomes invisible. The
side-to-side motions are not a significant fraction of a beam in this
region.
Enhanced Resolution Image of the M87 Core Region
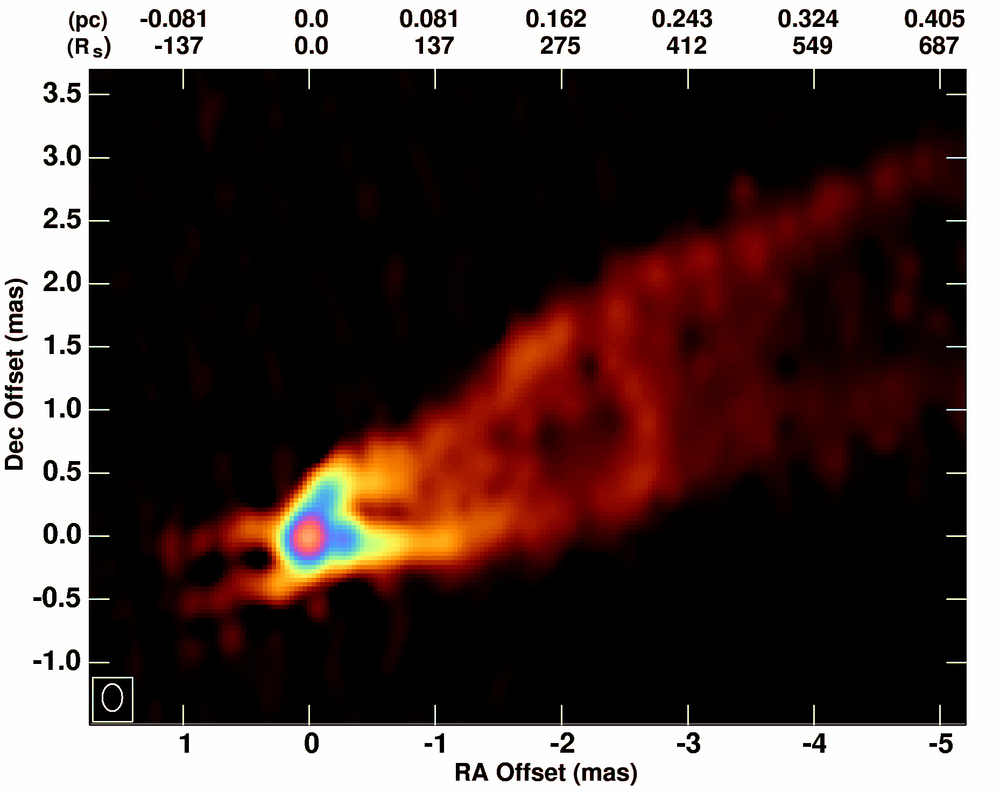
The last of the still images to be shown is one for the Jan. 12, 2013
data that was made with processing parameters that increased the resolution.
This image uses a beam that is 215 by 158 microarcseconds elongated north-south.
The intent here is to show the structure of the counterjet, which proves to
be rather symmetric with the bright-side jet.
M87 2007 VLBA Movie at 43 GHz
The first, and best, movie (gif file here, mp4 in the paper with
titles) is a normal resolution sequence (beam 0.43 by 0.21 mas at -16
deg PA) of the actual observations from the first 11 epochs of the
2007 observations. The ticks at the bottom of the frames are spaced
according to the times of the observations. The moving square shows
the date of the frame. The movie pauses on the first and last frames.
Interpolation was not used for the movie because it mainly confuses
the situation when motions of more than a beam between frames are
involved. It runs fairly fast because the visual impression of the
motion seems to be enhanced that way.
The above is a continuously looping animated gif. Click this link to see the same movie in mp4 format with headers and 4 repeats. This is the version in the publications.
To help appreciate the visual sense of motion that the movie above has, the following are links are to varients, one that runs in reverse, and two in which the image order has been randomized.
The movie with the frames in random order.
The movie with the frames
in a different random order.
M87 2008 VLBA Movie at 43 GHz
As mentioned earlier, the 2008 data were more densely sampled in
time as needed to avoid issues with feature identification and to
avoid aliasing. However the image quality was not as good as for the
2007 data because the dynamic scheduling could not be as effective
with narrow time windows. A movie can be made from these data and it
is shown below. The visual impression of motions is not as good, but
it is there.
The above is a continuously looping animated gif. Click this link to see the same movie
in mp4 format with headers and 4 repeats. This is the version
in the publications.
Movies of M87 in 2006 and 2010
Gif animations have been made of the images taken in 2006 as part of the pilot project and in 2010 in the follow-up to a TeV flare.
The 2006 data have a wide range of intervals, so the movie is a bit awkward to follow. The purpose of the observations was to determine the appropriate observing cadence so intervals between 3 days and 3 months were sampled. Longer intervals were thought not to be adequate based on older observations while shorter would only be required with extremely high velocities. The animation pauses on each image for a time proportional to the interval between the midpoints of the intervals before and after the point. The variable pause takes advantage of a capability to do that in gif animations.
The 2010 data were taken at about two week intervals, which was chosen as a compromise between the too-long interval of the 2007 observing and the degraded dynamic scheduling encountered in 2008 with 5 day intervals.
Click here for the 2006 and 2010 movies.
A Contour Movies and Velocity Measurements
In an effort to quantify the motions, the locations of identifiable components were determined on contour plots by eye and measured using PixelStick (very useful tool available at the Apple App Store). Similar images (with coarser contours), with the measured components marked are shown in the animations at the link below. Components that I thought could be related from one epoch to another are numbered. Of course, the opportunities for subjective bias to play a role in these determinations are high. The speed of the animations is much slower because of the need to read the component numbers.
To see the contour animations and the resulting plots of position
vs distance, speed vs core distance, and a histograms of number of
segments vs speed, go to this link.
Note that these plots are not the final ones in the paper but do not
differ significantly. However, an error in the original publication
of the paper has been found where the title for Figure 13 says it is
for the northern edge where the caption, which is correct, says it is
for the southern edge. We will attempt to fix that in the online
versions.
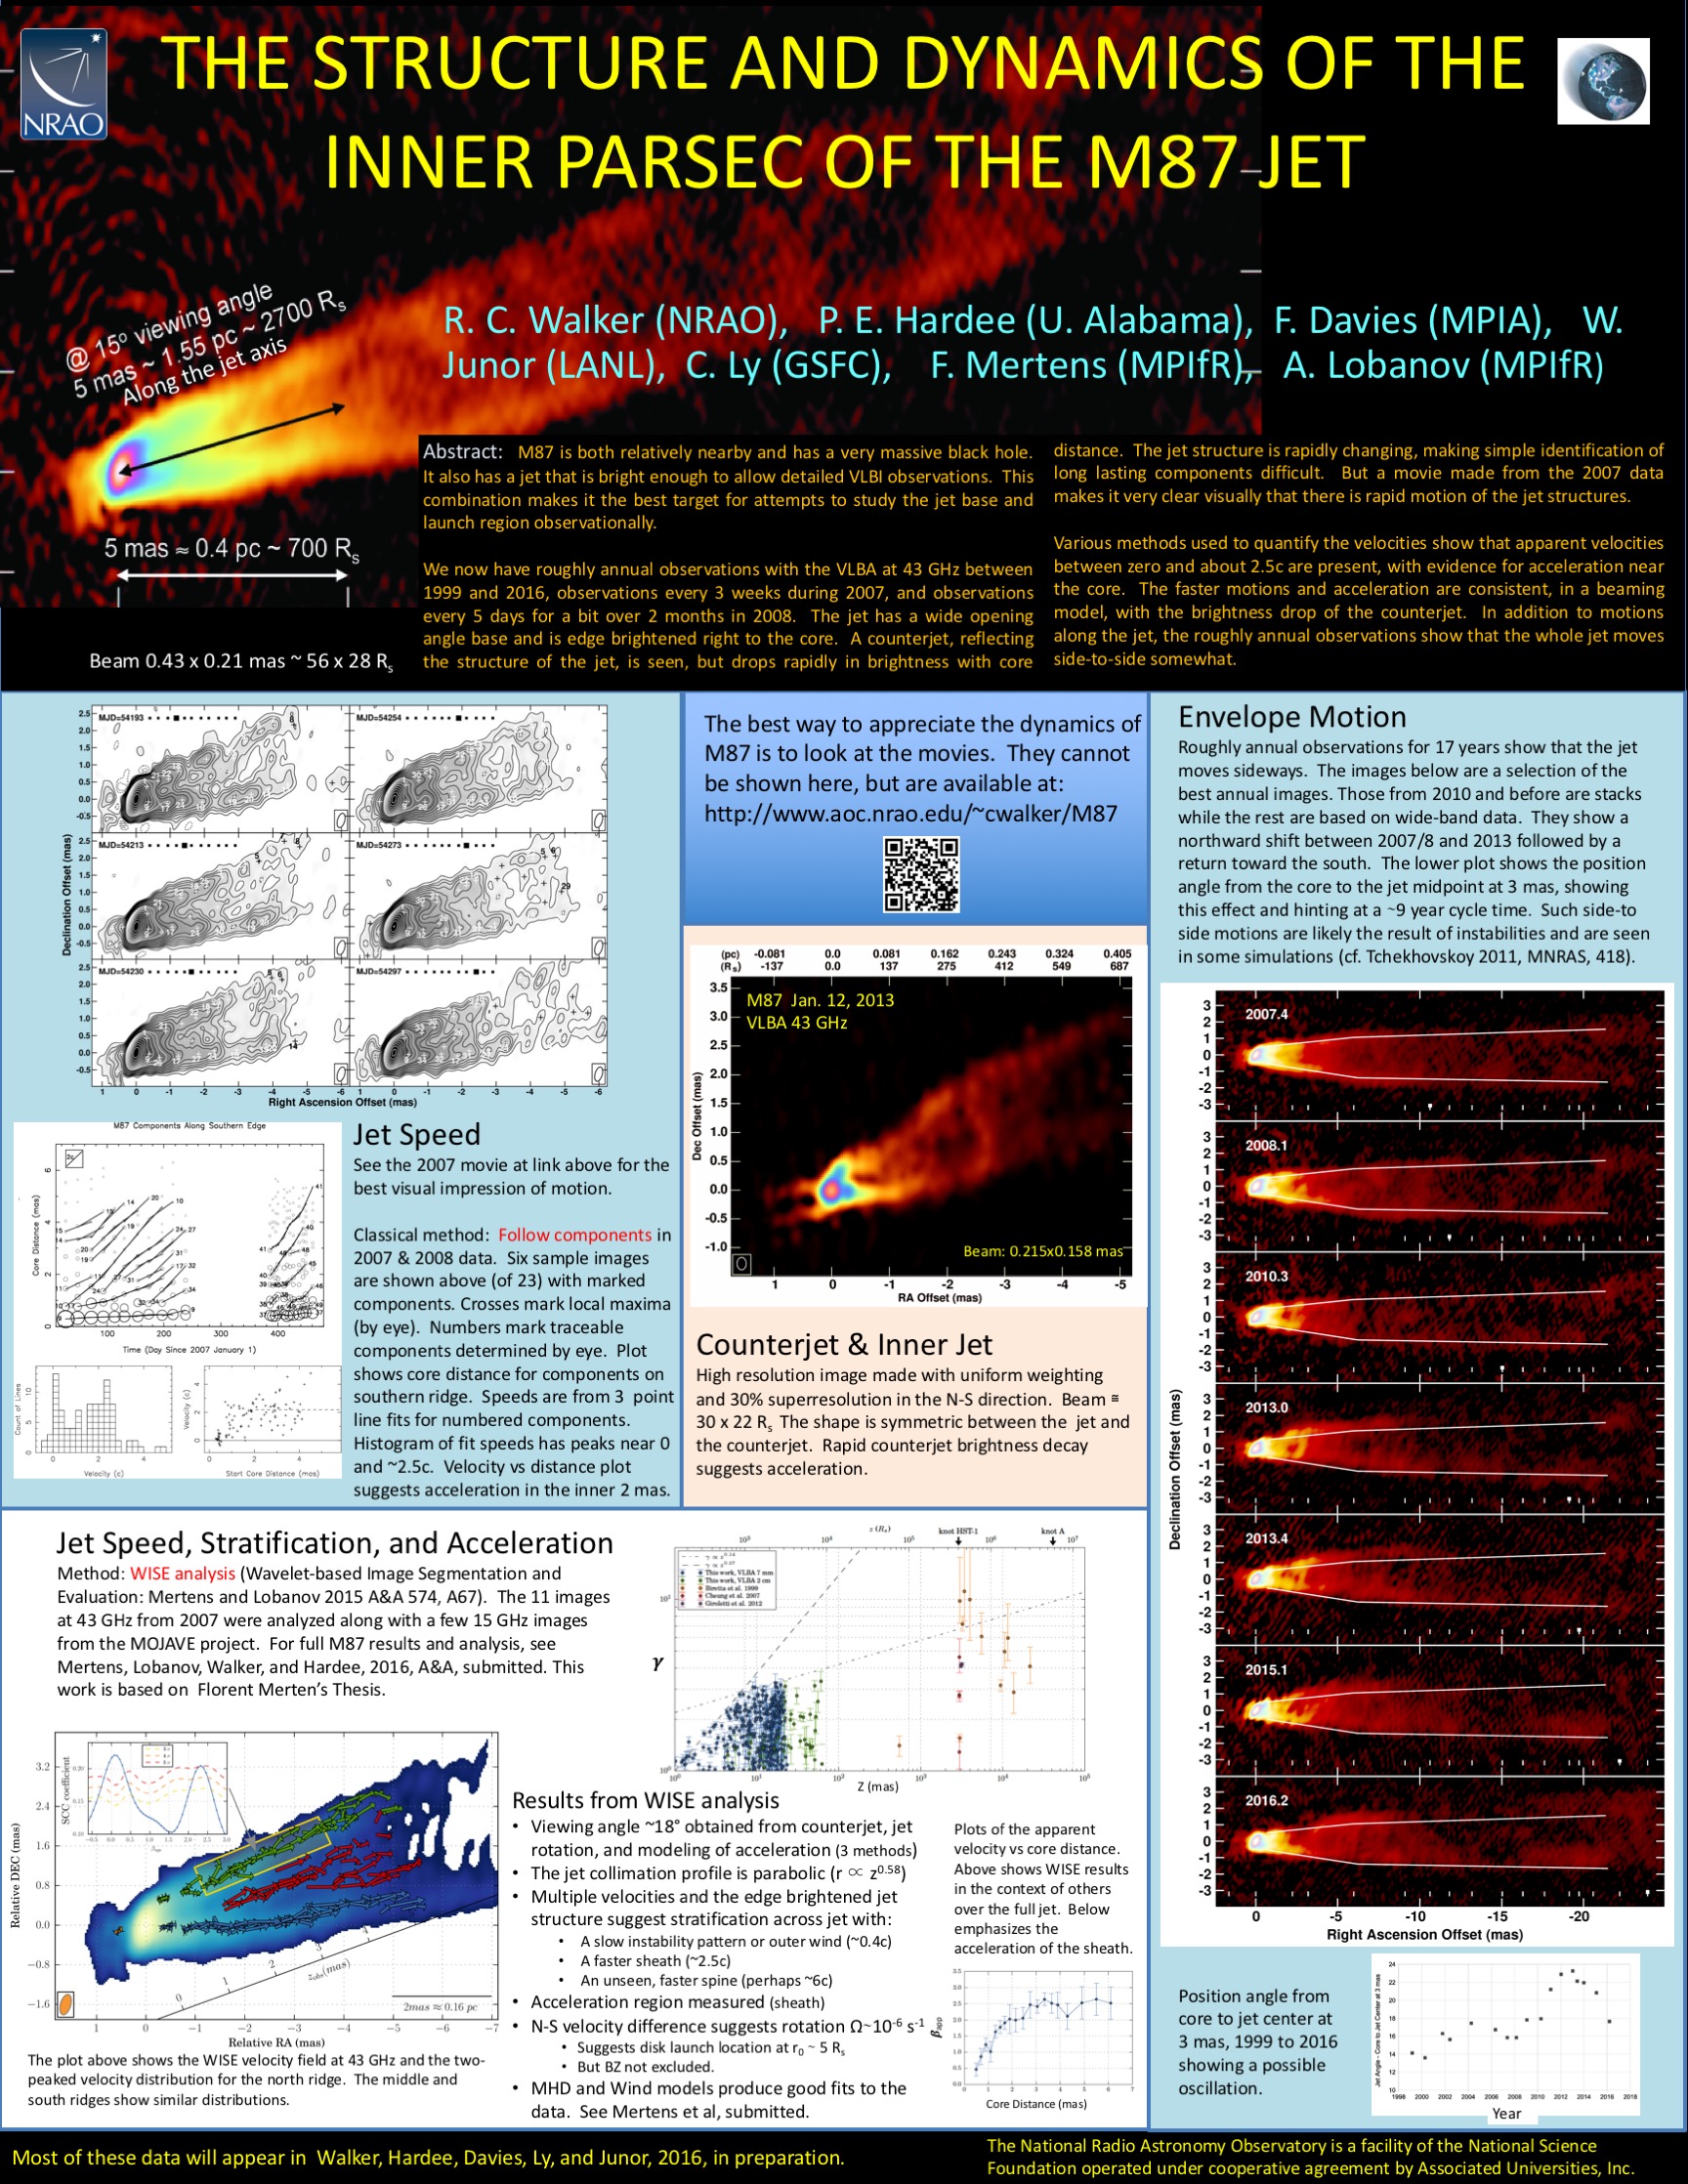
Roughly Annual Observations of M87 from 1999 to 2016
We have gathered 43 GHz observations taken by us, and by others in a few early cases, from nearly every year between 1999 and 2016. The first five epochs used here were published in Ly, Walker, and Junor, 2007. For the cases of 2006, 2007, 2008, and 2010, there were 6 to 12 separate observations. In those cases, we have formed RMS weighted stacks to represent those years at enhanced SNR, with the caveat that fine, changing structures will be smeared out. Montages showing all the "annual" images are shown at this link. These are gathered into a movie (gif animation) that is below. The order-of-magnitude range of noise levels in the images, combined with the need to display structures at very low levels to show the more distant parts of the jet in the better images, all using the same intensity-to-color transfer function, can cause the noise to be rather distracting in the noisier images. To avoid degrading the quality of the movie, the color scale was truncated at the low end at a different level for each frame of the movie. Where emission is shown, the flux density represented by each color is the same across all frames.
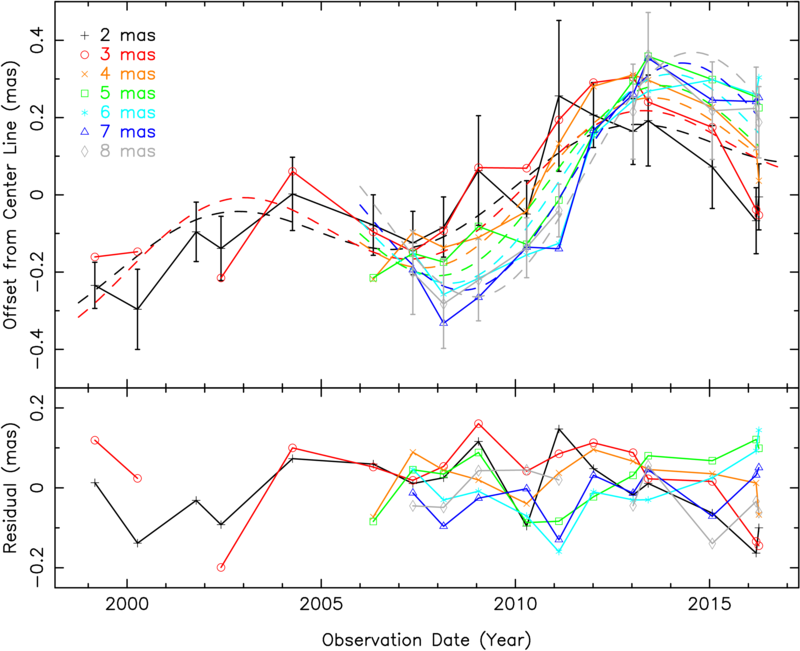
A result of this series of images is a demonstration that the jet
moves side-to-side by a noticeable amount. Two broken lines have been
placed on the images along the edge ridge lines in 2007 and 2008. It
is clear that, in 2013, the jet is significantly north of that
position. By 2016, it is most of the way back down. Below the movie,
there is a plot of the centerline angle measured at 3 mas (with
PixelStick again). There is what appears to be an oscillation with
about a 10 year period. It will take more cycles to be sure of this
effect, but that will take a rather long time. See the paper for
measurements of this angle along with fits for the propagation
velocity of the offset structure and it's implications. In short, the
velocity is fast, but not as fast as the faster component motions.
The nonballistic propagation speed is the expected result or a
Kelvin-Helmholtz instability in a jet with density comparable to or
less dense than the cocooning environment.
The above is a continuously looping animated gif. Click this link to see the same movie
in mp4 format with headers and 4 repeats. This is the version
in the publications.
In case you missed the link above, the individual images are at this page.
Here is the plot of the jet angle for various core distances vs time along
with the fitted model:
Polarization Structure
To date (Dec 2018), I have only calibrated two epochs for polarization. Both are from 2007. I have not invested much time in understanding the issues with the other epochs yet. My main effort is focused on the high sensitivity recent epochs, but they are suffering from lack of point calibrators, possible issues with 3C279 as a calibrator, frequency dependent polarzation characteristics, possible software issues, and lack of my time. The images I have show interesting structure with E vectors wrapped around the back side of the core, and pointing along the jet on the jet side, including showing the wide opening angle (and assuming that Faraday rotation and other effects are not confusing the issue). Someday I will try to improve the polarization calibration. In any case, follow this link to the two polarization images I have.
Stripped down page.
A version of this page that only shows the 3 main movies and almost
no text is at M87_movies_only.html
It was intended for use on an iPad on an AAS meeting poster, but I found
another scheme to use for that.
References
No attempt has been made above (yet) to reference other people's work about the structure and dynamics of M87. That may come in time. Many are referenced in Walker et al. (2018). A quick ADS search will turn up much. One name, in particular, to search for is Kazuhiro Hada.
The primary reference for this work is given in the first paragraph above. Repeating here, it is:
Walker, R.C., Hardee, P.E., Davies, F.B., Ly, C., and Junior, W. 2018, Ap. J. 855, 128. "The Structure and Dynamics of the Subparsec Jet in M87 Based on 50 VLBA Observations over 17 Years at 43GHz" The paper, in various forms, can be accessed through this ADS link. The paper was also submitted in preprint form to astroph (arXiv). A pdf copy is available here. It does not show the movies, but they, or similar gif versions, can be found on these web pages along with additional displays.
An important analysis of M87 velocity field based on our 2007 data was made by Mertens et al. They showed the presence of both fast moving and slow components, along with acceleration in the first 2 mas, using a wavelet based analysis. The reference is: Mertens, F., Lobanov, A. P., Walker, R. C. and Hardee, P. E. 2016, A&A, 595, A54. "Kinematics of the jet in M87 on scales of 100-1000 Schwarzschild radii."
The results from 2004 and earlier have been published by Chun Ly, who was my summer student at the time and has remained involved in the project:
Ly, C., Walker, R. C., and Junor, W. 2007. Ap. J. 660, 200. astro-ph/0701511 "High Frequency VLBI Imaging of the Jet Base of M87
The normal reference for our work has been to a "refereed" meeting proceedings from 2008. That proceedings is on-line and the movie for 2007 is included.
Walker, R. C.; Ly, C.; Junor, W.; Hardee, P. E. 2008, in "The Universe under the Microscope - Astrophysics at High Angular Resolution" eds R. Schodel, A. Eckart, S. Pfalzner, and E. Ros. J. Phys.: Conf. Ser. 131 012053 http://iopscience.iop.org/1742-6596/131/1/012053 "A VLBA movie of the jet launch region in M87"
The results concerning the TeV flare in 2008 were published in Science. Included were some images showing the appearance of a new feature related to the flare.
Acciari, V. A. et al.: The VERITAS Collaboration, the VLBA 43 GHz M87 Monitoring Team, the H.E.S.S. Collaboration, and the MAGIC Collaboration, 2009, Science Magazine, 325, 444. (July 24, 2009) "Radio Imaging of the Very-High-Energy Gamma-Ray Emission Region in the Central Engine of a Radio Galaxy" On-line materials author list: M. Beilicke, F. Davies, P.E. Hardee, H. Krawczynski, J.-P. Lenain, D. Mazin, M. Raue, F. Rieger, S. Vincent, R. Wagner, R.C. Walker and the collaborations.
As part of this project, we did astrometric observations between M84 and M87. We have a detection of the relative proper motions of those two sources. I have not yet added those results to this page. They will be published with Fred Davies, who did much of the processing, as first author.
Recent Meetings
Portions of the results from this project have been reported at several meetings. The two most recent were held in May 2016 are given below:
The first is the
M87 Workshop, May 23-27, 2016, at ASIAA in Taipei. A poster was
given although I was not able to attend in person. The poster can be viewed
at
the Taiwan meeting web site. This version is 15 MB. If you have
limited bandwidth, this link is a
1.2MB jpeg version..
The second meeting is Blazars through Sharp Multi-Wavelength Eyes", May 30 - June 3, 2016 in Málaga, Spain. I gave an invited talk: "Observations of the Structure and Dynamics of the Inner M87 Jet". Use this link to see the slides. The proceedings article is at: Walker, R. C., Hardee, P. E., Davies, F., et al. 2016, Galax, 4, 46.
A poster showing results from this project was shown at the AAS general
meeting in Seattle on January 9, 2018. It was in the ngVLA special session.
More information for the collaborators on this project is available in a password-protected area.
DATA
Some information and data that might be useful for others working
on M87, or on imaging techniques, is available.