M87 Contour Movies and Speed Measurement
In an effort to quantify the motions, the locations of identifiable
components were determined on contour plots by eye and measured using
PixelStick (very useful tool available at the Apple App Store).
Similar images (with coarser contours), with the measured components
marked are shown in the following animation. This is just the 2007
data. Components that I thought could be related from one epoch to
another are numbered. Of course, the opportunities for subjective
bias to play a role in these determinations are high. The speed of
the animation is much slower because of the need to read the
component numbers.
Below is the similar animation fo rthe 2008 data. Recall that
the quality of the individual epochs is often not as good as
for the 2007 data because we were forced to live with less good
observing conditions. These observations were approximately every
five days. There are a couple of gaps were we were unable to produce
an acceptably good image from the data that were gathered.
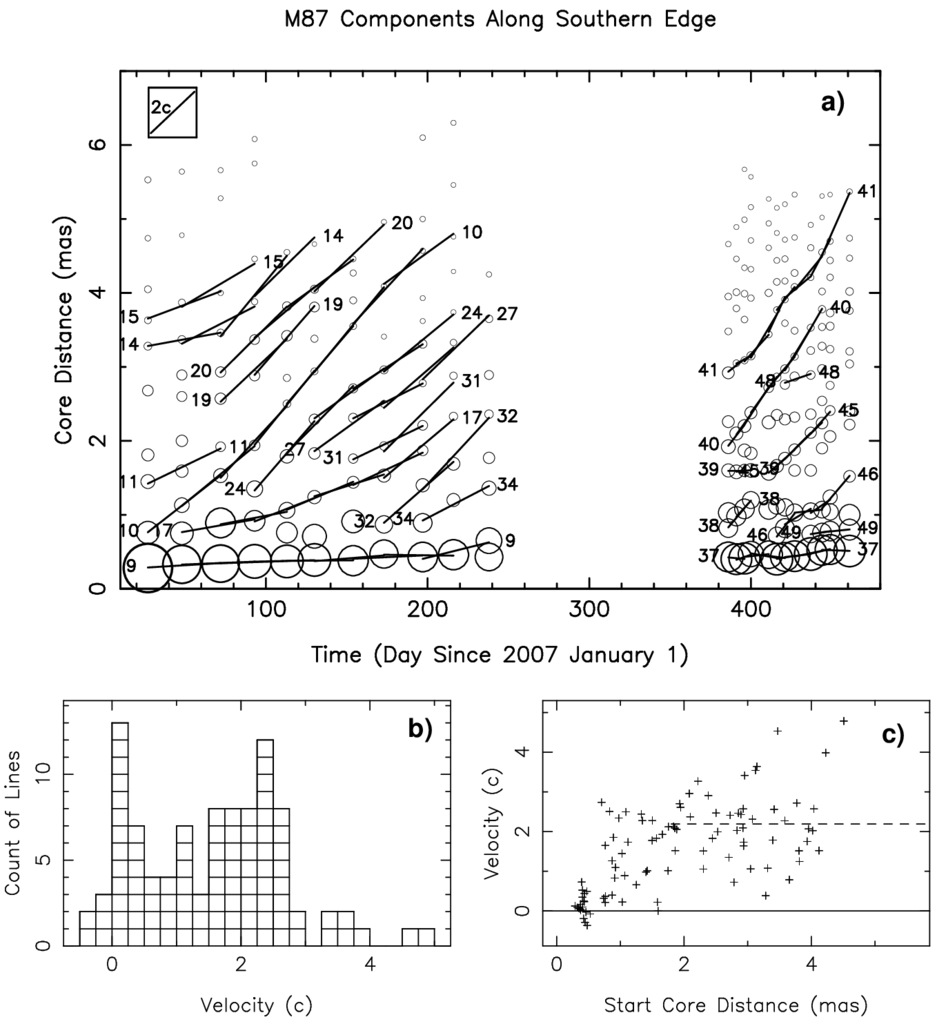
The plot below shows the positions of all components along
the southern edge of the jet vs time for
both the 2007 and 2008 data. Wherever a numbered component can be
connected by a reasonably straight line between 3 epochs, a fit for
motion with position and velocity was made and plotted as a line
segment. The boxes below a histogram of the speeds and a plot of the
speed vs distance from the core (brightest point). A wide range of
speeds is seen with peaks in the distribution at very slow and near
2.5c. Also the speeds very close to the core are slow, suggesting
acceleration over the first 1-2 milliarcseconds. Click on the link
for the same plot for the northern edge components.
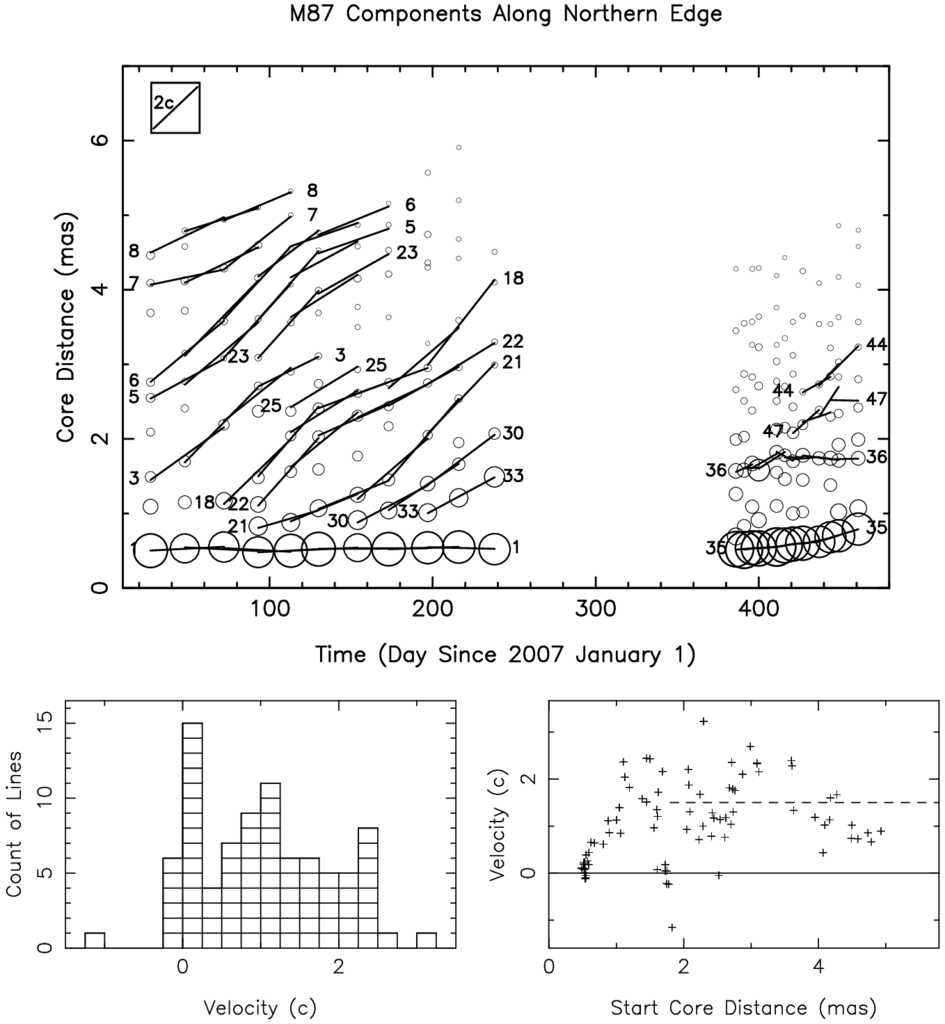
Below is the same sort of plots for the northern side of the jet.
The velocity measurements above are based on the traditional VLBI method of identifying components in multiple epochs and measuring how far they move. Florent Mertens, as part of his Ph.D. thesis work at MPIfR used the Wavelet-based Image Segmentation and Evaluation (WISE) method to identify features and measure velocities. He finds overlapping velocity systems near 0.5x and 2.5c. A paper on this work, along with extensive interpretation, was submitted in early May 2016. The reference is:
Mertens, F., Lobanov, A. P., Walker, R. C. and Hardee, P. E. 2016, A&A, submitted. "Kinematics of the jet in M87 on scales of 100-1000 Schwarzschild radii."