
 GCNEWS
A Newsletter for Galactic Center Research
This Volume was edited by Sera Markoff, Loránt Sjouwerman, Joseph Lazio, Cornelia Lang, Rainer Schödel & Robin Herrnstein
email: gcnews@aoc.nrao.edu
GCNEWS

Shep Doeleman1 & Geoff Bower2
1 MIT Haystack Observatory
2 UC Berkeley
At the recent Sgr A* birthday conference in Green Bank, WV, a number of exciting results, which are bringing us closer to a better understanding of the dynamics and processes at work in the Galactic Center, were reported. Among these results are several that focus on the ultra-compact region surrounding the central mass. In the NIR, Sgr A* has now been observed in both a quiescent and flaring state (Genzel et al. 2003; Ghez et al. 2004) with flare rise times that restrict the emission to be within a volume of tens of Schwarzschild radii across. A possible approximately 17 min. periodicity observed in the flares can be explained as a relativistic modulation of the accretion flow near the last stable orbit of a 3.6 million solar mass black hole. X-ray flares of Sgr A* observed by both Chandra and XMM (Baganoff et al. 2001; Goldwurm et al. 2001) exhibit similar rise/decay times with commensurate limitations on the volume of origin. Furthermore, detection of linear polarization at wavelengths shorter than 3 mm (Aitken et al. 2000; Bower et al. 2003) places important constraints on the accretion rate and accretion process within hundreds of Schwarzschild radii of the black hole. These results provide important input to models of Sgr A* emission, but they are not direct measurements of size or structure.
Due to the proximity of Sgr A*, high resolution imaging techniques can achieve unprecedented linear resolution of this black hole. NIR interferometry with current instruments such as the VLTI have a maximum resolution of about 100 Schwarzschild radii. In the far future, space-based X-ray interferometry may obtain a resolution of 10-2 Schwarzschild radii. Only very long baseline interferometry (VLBI) at mm and submm wavelengths currently provides the means to directly image Sgr A* on scales comparable to the Schwarzschild radius. In as much as Sgr A* can be taken as the Rosetta Stone for more massive and more luminous AGN, VLBI observations have the potential to provide us with a unique and detailed view of AGN cores on scales where relativistic effects and strong gravity dominate.
The basic observing challenge is that Sgr A* lies behind a screen of turbulent interstellar plasma that scatters radio waves and broadens VLBI images. This broadening scales as lambda 2, requiring VLBI observations over a range of wavelengths and with an emphasis on the short wavelength end. The most recent VLBI results (Bower et al. 2004), conclusively detect a 24 Rsch intrinsic size at 7 mm wavelength, providing the most stringent mass density lower limits to date for Sgr A*.
In this article we summarize the current state of VLBI observations of Sgr A* and the methods used to extract sizes and structures. We also discuss the future possibilities for VLBI at shorter wavelengths that will provide us with angular resolutions as fine as 20 microarcseconds, or approximately 2 Rsch.
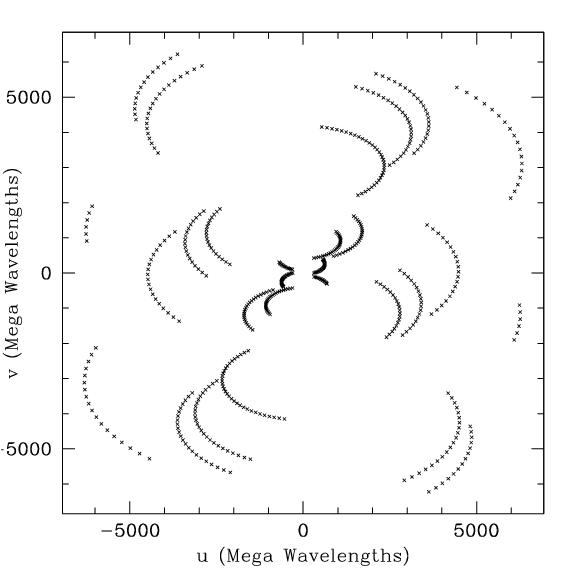
Traditional VLBI imaging begins by correlating data taken on an array of radio telescopes, yielding complex correlation coefficients for each antenna-antenna baseline for each integration time and bandwidth channel. Each baseline, time, and frequency datum can be placed in a (u,v) plane with axes representing the projected baseline lengths (measured in wavelengths) in the north-south and east-west directions. A single baseline traces out an elliptical path in this plane as the Earth rotates, providing correlation measurements for many baseline lengths and orientations (see Figure 3 for an example). Interferometric imaging hinges on the fact that the (u,v) plane and the ``sky'' plane are Fourier Transform pairs, so the calibrated correlation data are transformed from the (u,v) plane to make a sky image. Typically, this image must go through a further process of deconvolution to remove the effects of sparse sampling in the (u,v) plane.
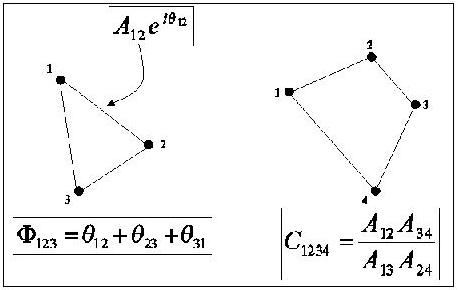
Phase and amplitude calibration of VLBI data assume that calibration parameters can be ``stationized,'' so that the proper calibration for a baseline is the product of two complex gains, one for each antenna in the baseline. This is a valid way to describe the array response under most circumstances. Unfortunately, it can be difficult to obtain calibration measurements with the frequency or the accuracy necessary to produce a high quality image. With this assumption of station-based calibration, however, one can compute two quantities which are independent of the calibration, the closure phase and the closure amplitude. The closure phase is a sum of the interferometric phase around a triangle of antennas (three baselines in a closed loop); all sources of station-based errors cancel and leave a quantity that directly relates to source structure. Similarly, the closure amplitude is calculated by forming the ratio of products of complex correlation data around a closed loop of four antennas (Figure 1).
Calibration is especially difficult for mm VLBI experiments and even more so for mm VLBI experiments targeting Sgr A*. Contributions to errors in the calibration include low sensitivity, variable atmospheric opacity, variable atmospheric path length, antennas deformation under gravity, and antenna pointing errors. These problems are all the more severe for the case of Sgr A*, which is observed only at low elevation from the Northern hemisphere. Thus, it is often preferable to directly model the closure quantities and perform a X2 minimization to determine the most likely structure given a family of parameterized source models. The relatively simple structure of Sgr A* and the relatively small number of VLBI data points make this approach both computationally tractable and an efficient way to search for structural asymmetries and deviations from the scattering law.
Closure amplitude analysis of Sgr A* VLBI observations was first carried out by Doeleman et al. (2001) using data at 3.5 mm wavelength taken with a six station array including 3 Very Long Baseline Array (VLBA) antennas, the Kitt Peak 12-m, the Owens Valley mm array, and the Berkeley-Illinois-Maryland Array at Hat Creek. The sparse (u,v) coverage and low sensitivity of these observations limited the complexity of source models that could be considered for the structure of Sgr A*. A broad range of possible elliptical Gaussian models was searched, but the data were adequately fit by a more simple circular Gausssian brightness distribution with a full width half maximum (FWHM) size of 0.18 +/- 0.02 milliarcseconds. This size is, within the errors, consistent with the expected scattering size at 3.5 mm wavelength, and the experiment placed a strong upper limit of 0.13 mas (20 Rsch) on any intrinsic structure at this wavelength. This result cast some doubt on earlier 7 mm wavelength VLBI results which claimed to have detected intrinsic structure using conventional VLBI calibration and analysis methods (Lo et al. 1998).
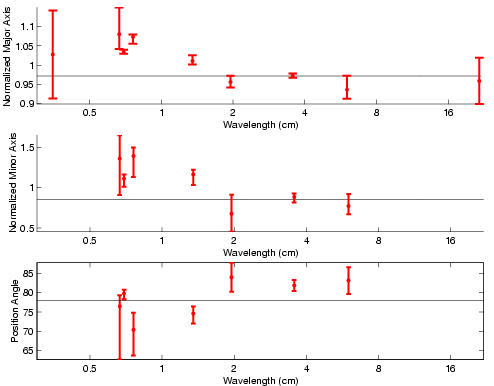
Prompted by these results, Bower et al. (2004) recently applied closure amplitude and closure phase analysis to longer wavelength data obtained with the VLBA. The VLBA data span 6 cm to 7 mm wavelength and include a total of 19 experiments. For each data set, we computed the closure amplitudes and closure phases, and used a nonlinear X2-minimization technique to search through a range of possible source structures. All data were consistent with the source as a single elliptical Gaussian. Though the data do not support a two-component model, formal limits can be set on the flux density of a potential secondary component of a few percent to about 20% of the flux density of the main component. Under the assumption that the source is an elliptical Gaussian, we fit a major axis size, minor axis size and position angle (Figure 2). Combining the VLBA data at 2 cm and longer wavelengths with archival Very Large Array data at 20 cm, we are able to calibrate the scattering law to better than 1% as well. The major and minor axis sizes at these long wavelengths are fully consistent with a lambda 2 law. At 7 mm, however, the difference between our measured size and the expectation of the scattering law is 40 microarcseconds: a detection of intrinsic structure in Sgr A* at the 7 sigma level. This difference translates to an intrinsic size for Sgr A* of 24 +/- 2 Schwarzschild radii at 7 mm observing wavelength. We are able to obtain a similar, although less accurate, measurement at 1.3 cm, which implies a wavelength dependence of the intrinsic size that is roughly proportional to lambda 1.5.
The upper limit on the intrinsic size at 3.5 mm of 20 Schwarzschild radii determined by Doeleman et al. shows that the size continues to decrease with decreasing wavelength. New results from VLBA imaging at 3.5 mm presented by Shen et al. at the Sgr A* 30th birth day meeting indicate a size of 10 Schwarzschild radii. Altogether, these are the highest resolution observations of any black hole system in units of the event horizon.
We can draw several conclusions based on these results. The compact size strongly excludes Bondi-Hoyle accretion flows and advection dominated accretion flows for Sgr A*. This is in agreement with the low mass accretion-rate interpretation of linear polarization measurements (Bower et al. 2003). The wavelength-dependence of the size also excludes a homogeneous synchrotron source explanation. The exact nature of the accretion and emission region is still uncertain, however. Both radiatively inefficient accretion flows and jet models can reproduce the intrinsic size.
We can use the measured size along with the upper limit to proper motion of the black hole (most recently reported by Reid et al. at the 30th birthday meeting) to limit the mass density of the black hole to 4 * 104 Mo AU-3. This density rules out all but the most exotic alternatives to a supermassive black hole scenario for the central mass at the Galactic Center, and makes Sgr A* the leading candidate for a massive black hole.
The intrinsic size of Sgr A* decreases strongly with decreasing wavelength. If the power-law that we observe continues to even shorter wavelengths, then the source will become comparable to the event horizon scale around a wavelength of 1.3 mm. On this scale, the image will be severely distorted by propagation effects in the strong gravity of the black hole (Falcke, Melia, & Agol 2000; Takahashi et al. 2004). Radiation traveling close to the black hole will be gravitationally lensed and appear in a ring with an inner radius of 5 Schwarzschild radii. Detection of this ring will provide the tightest constraint ever placed on the mass density of a black hole. Asymmetries in the image may also reveal information about the spin of the black hole. These observations may also detect the motion of matter around the black hole: The period of the last stable orbit around the black hole is approximately 20 min.
Sgr A* is the best candidate for these measurements. We show in Table 1 other potential sources for this measurement. The closest candidate is M87, which has an event horizon radius about half that of Sgr A*. The maximum wavelength for the experiment is set by the shadow diameter and by the wavelength at which the image becomes optically thin. An Earth-baseline has a resolution of 34 microarcseconds at 1.3 mm, just sufficient to detect the hole. The spectrum becomes optically thin somewhere in the millimeter wavelength band, although the exact wavelength is unknown. It is likely that observations will have to be made at 1.3 and 0.8 mm wavelength.
| Source | Black Hole Shadow Diameter |
|---|---|
| Sgr A* | 64 micro-arcsec |
| M87 | 38 micro-arcsec |
| NGC 4649 | 24 micro-arcsec |
| Cen A | 10 micro-arcsec |
These are technically demanding observations. Current efforts to image Sgr A* with VLBI are limited by the high detection thresholds at wavelengths much shorter than 7 mm and by limited baseline coverage. The baseline scarcity at longer wavelengths follows from the larger scattering size of Sgr A* and the tendency of long baselines to resolve the observed structure. At the short wavelength range, the number of available telescopes that can participate in VLBI drops off sharply, which results in a poorly sampled (u,v) plane.
There are two major developments on the horizon which will dramatically change the landscape for VLBI of Sgr A*. The first is a new generation of VLBI recording technology which will, over the next 5-10 years, enable data rates approximately 64 times higher than current sustainable rates at the VLBA (Whitney, Lapsley, & Doeleman 2003). A VLBI array with these wideband systems will improve continuum sensitivity by a factor of 8. The second important advance will be the commissioning of several new large aperture mm and submm telescopes that can join a short wavelength VLBI array providing long, sensitive baselines yielding exceptionally high angular resolution. These new telescopes--ALMA, CARMA, and the SMA among them--can potentially provide a further increase in sensitivity of a factor of 10 for some VLBI baselines. The combination of increased bandwidth and larger telescopes will result in an overall boost of VLBI sensitivity at wavelengths shorter than 3 mm by about 2 orders of magnitude. Table 2 shows how we expect the sensitivity and number of antennas for 1.3 mm VLBI to evolve over the next decade. Within 3 to 5 years, the sensitivity will be sufficient to make a 10 to 20 sigma detection of Sgr A* on most baselines in 10 seconds.
| Present: 0.5 Gb s-1 | 3-5 yrs: 4 Gb s-1 | 5-10 yrs: 16 Gb s-1 | |||
|---|---|---|---|---|---|
| Antenna and SEFD (Jy) | Antenna and SEFD (Jy) | Antenna and SEFD (Jy) | |||
| Kitt Peak | 22 000 | JCMT | 7800 | ALMA | 100 |
| Pico Veleta | 2500 | APEX | 5500 | | |
| P. de Bure | 2500 | CARMA | 2500 | ALMA-SMTO = 0.005 Jy | |
| SMTO | 15 000 | LMT | 500 | ALMA-LMT = 0.026 Jy | |
| | SMA | 2500 | | ||
| | CSO | 15 000 | | ||
| | | | |||
| PicoV-PdeB = 0.4 Jy | LMT-CARMA = 0.06 Jy | Resolution (8000 km) = 34 mas | |||
| PicoV-KittPeak = 1.15 Jy | LMT-SMTO = 0.15 Jy | Integration Time = 10 seconds | |||
A collaboration including Haystack Observatory, IRAM, MPIfR-Bonn, and the University of Arizona has carried out VLBI tests at 2.3, 2.0, and 1.3 mm, with a focus on addressing the technical difficulties involved in extension of VLBI to mm and submm wavelengths. These efforts have been successful, with productive experiments conducted at 2.3 and 2.0 mm in 2002 April, and at 2.3 and 1.3 mm in 2003 April. Among the results were VLBI images of SiO maser emission around the evolved star VY Canis Majoris in the v=1, J=3->2 ro-vibrational transition at 2.3 mm (Doeleman et al. 2003). This series of experiments also set successive world records for angular resolution, the most recent of which is 34 microarcseconds, achieved in 2003 April on the Pico Veleta-SMTO baseline at 1.3 mm, on the quasar 3C 454.3. This VLBI development extends previous moderate baseline length experiments at 2 mm (Greve et al. 2002) and at 1.3 mm (Greve et al. 1995; Krichaum et al. 1997). Sgr A* has already been detected on the 1150 km Pico Veleta-Plateau de Bure VLBI baseline at 1.3 mm (Krichbaum et al. 1998).
The technical challenges in extending VLBI to these short wavelengths will require continued development. A major obstacle is decorrelation of the VLBI signal by turbulence in the atmosphere, which sets limits on the effective integration time and the detection thresholds. Techniques to increase the integration time, or ``coherence time,'' include using water vapor radiometers to measure changes in the atmospheric path length and sophisticated averaging techniques. Water vapor radiometers may also be important for achieving the phase stability required for phase-referenced astrometry that will make high time resolution imaging possible.
Antenna receiver electronics may also limit coherent integration times, especially in the domain of long (> 10 seconds) integration times made possible through the use of phase correction techniques. The noise introduced by local oscillators used in the receiver increases with decreasing observing wavelength, and careful testing of the signal paths in each VLBI antenna is necessary. At many sites, we replace standard frequency references with specialized oscillators for VLBI observations to ensure spectral purity and time stability. At the heart of each VLBI system is a hydrogen maser which produces a reference tone stable enough that signals from different VLBI stations can be correlated. But, as we approach wavelengths shorter than 1.3 mm, even hydrogen masers introduce some decorrelation in the VLBI signal. It is expected that within roughly 10 years, new frequency standards based on optically trapped and cooled atoms will exceed the stability of masers and become useful for short wavelength VLBI.
For the new arrays, CARMA and ALMA, it will be important to ensure that all antennas in each array can be phased together to provide a single large aperture. In principle this is not difficult, but it can require specialized observing modes to phase the dishes in real-time before the summed signal for all antennas is recorded by the VLBI system. The phased ALMA will be the most sensitive short wavelength facility and provides crucial north-south baselines that are currently poorly sampled. Furthermore, baselines to ALMA will be sensitive enough (see Table 2) that all baselines to ALMA will be able to detect Sgr A* within an atmospheric coherence time. Once in this regime, the VLBI array becomes quasi-phase stable with ALMA baselines providing real-time phase correction for the entire array, and less sensitive baselines can simply integrate in time until Sgr A* is detected. Figure 3 shows the baseline coverage possible using a 1.3 mm array of seven antennas including ALMA.
Sgr A* is a critical testing ground for studying astrophysics in the strong gravity of a black hole. In addition to probing gas dynamics and emission physics in this extreme environment, a high resolution VLBI image of Sgr A* will provide one of the tightest constraints on the mass density of a black hole possible.
The technical requirements for these experiments are stringent. A number of new developments, however, make these results attainable on the time scale of first light with ALMA. These developments include the new telescopes at mm and submm wavelengths; high bandwidth recording systems; phase correction techniques; and, time standards. Given these technical developments, there is no fundamental obstacle to extending VLBI of Sgr A* to 0.8 mm with an angular resolution of 20 microarcseconds (2 Rsch). The necessary groundwork for Sgr A* VLBI imaging is underway with long baseline 1.3 mm VLBI experiments planned for early 2005, which will link antennas in Hawaii with the Western US. The recent success of short wavelength VLBI experiments coupled with the rapid pace of VLBI recording technology, suggest that initial 5-station 1.3 mm VLBI imaging of Sgr A* could take place before 2010.
References