![[NRAO]](nraologo1.gif)
|
|
7th NRAO Synthesis Imaging Summer School - June 2000 | Prev |
| Error Recognition - S.T. Myers | Page 14 | |
| Next |
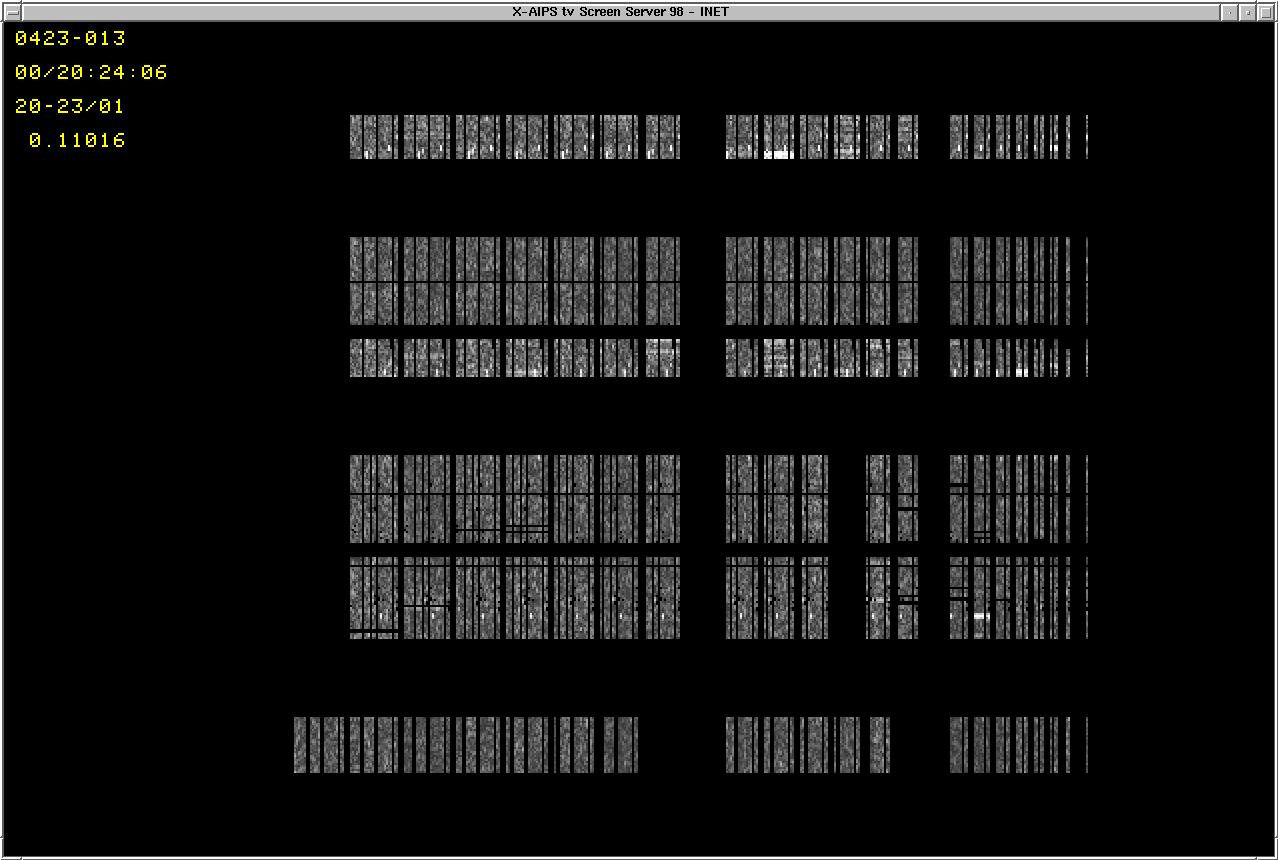
| 10 | Example Screen Shot from AIPS TVFLG: | ||
| |||
| This 22 GHz continuum data is from March 2000 showing greyscale amplitude differences between each 3.3 second integration and the running boxcar mean of 3 integrations, plotted versus time (vertical) and baseline (horizontal). Bad integrations on single antennas show up replicated on all baselines to other antennas. These errors are due to slight data dropouts due to a software timing problem in the lobe rotator (since fixed). | |||
| Next Page: Plotting Tant | |||