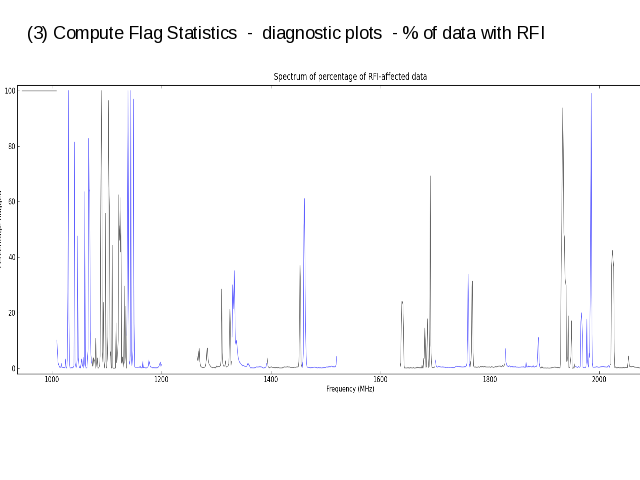
A plot of the % of flagged data as a function of channel/frequency. The colours indicate different spectral windows (to make the boundaries clear)
Flag counts are displayed separately for spw and fieldid. When there are multiple fields per spw, they appear as different shades of blue/black.
This info can be used to generate lists of freq-ranges with more than 80% data flagged, or lists of 'clean freq-ranges' for later processing.