CSE 221
Project – Winter 2003
System
Performance Measurements
on
RedHat Linux
8.0 and Windows XP 5.1
Project Members:
Urvashi
Rao Venkata
Reena
Mathew
Table of Contents
4.1 Disk access
(read-write-read)
4.2 Sequential Vs Random
Reads
5.2 Function performance
with different implementation styles.
6.1 Integer and Float
Operations
Table of Figures
Figure
1 : Code Segment for Memory Access
Figure
2 : Graphs for Memory Access
Figure
3 : Graph for Memory Access for Code plus Data
Figure
4 : Code Segment for Looping and Sub-Looping
Figure
5 : Graphs for Sub-Looping with 8192KB on Linux
Figure
6: Graphs for Sub-Looping with 8192KB on Windows
Figure
7 : Code Segment for Disk Access using 'fread' and 'fwrite'
Figure
8 : Graphs for Disk Read And Write Access on Linux
Figure
9 : Graphs for Disk Read And Write Access on Windows
Figure
10 : Code Segment for Disk Access using 'open' and 'close'
Figure
11 : Graphs for Disk Read And Write Access on Linux
Figure
12 : Graphs for Disk Read And Write Access on Windows
Figure
13 : Code Segment for Disk Access using 'mmap' and 'munmap'
Figure
14 : Graph for Disk Access using 'mmap' and 'munmap'
Figure
15 : Code Segment for Sequential and Random Disk Access
Figure
16 : Graphs for Sequential and Random Disk Access on Linux and Windows
Figure
17 : Graphs for Sequential and Random Disk Access on Linux to determine Page
Read Ahead Size
Figure
18 : Graph for Sequential and Random Disk Access on Windows to determine Page
Read Ahead Size
Figure
19 : Code Segment for 'read' Vs 'mmap'
Figure
20 : Graphs for Disk Access using 'read' and 'mmap'
Figure
21 : Individual graphs for 'mmap' and normal ' read-write'
Figure
22 : Table for read and mmap timings
Figure
23 : Code Segment for Local and Remote Disk Access
Figure
24: Graphs for Local and Remote Disk Access
Figure
25 : Code Segment for System Calls
Figure
26 : Table of performance of system calls
Figure
27 : Code Segment for different call types
Figure
28 : Graphs for Inline Vs Function Vs Recursion calls on Linux
Figure
29 : Graph for Inline Vs Function Vs Recursion on Windows
Figure
31 : Code Segment for Arithmetic Operations
Figure
32 : Graphs for Arithmetic Operations.
Figure
33 : Graphs comparing Linux and Windows
memory access bandwidths
Figure
34 : Graphs for Code plus data with different levels of optimization on Linux
Figure
35 : Graphs for Code plus data with different levels of optimization on Windows
Figure
36 : Graphs comparing Linux and Windows with O3 optimization level
Figure
37 : Graphs comparing the Sub-Looping between Linux and Windows
Figure
38 : Graphs comparing disk read bandwidths for Linux and Windows
Figure
39 : Graphs comparing disk write bandwidths for Linux and Windows
Figure
40 : Graphs comparing Sequential and Random disk access between Linux and
Windows
Figure
41 : Graphs for comparing the disk accesses for Page Read Ahead between Linux
and Windows
Figure
42 : Graphs comparing the times for different call types on Linux and Windows
1
Introduction
This project involves measuring the performance of an Operating System
(OS) based on hardware architecture. It discusses a set of metrics that can be
used to evaluate the performance of certain features of an Operating System.
Measurements were made on two Operating Systems, RedHat Linux 8.0 and
Windows XP 5.1. The measurements for each operating system have been evaluated
and compared between the two operating systems. Observations have been
discussed and conclusions have been made with respect to each type of
measurement.
2 Project Overview
The goal of the project has been to evaluate the performance of two
different operating systems on the same hardware. The metrics chosen fall into the
categories of memory access, disk access, processes and arithmetic operations.
Architecture
Hardware – Dell Inspiron 2650
Processor – Intel(R) Pentium(R) 4 CPU 1.70 GHz
Cache Size – 512 KB
RAM Size – 256 MB
Hard Disk – 30 GB
Operating Systems
(i) Redhat Linux Version 8.0
(ii) Microsoft Windows XP Version 5.1.2600 Service Pack 1.0
- Cygwin 1.3.20-1 (UNIX
environment for Windows)
Compiler
gcc3.2 – C compiler (on Linux and
Cygwin)
Benchmarking and performance measurements correspond to sampling a
multidimensional space spanned by non-orthogonal axes. Measurements are often
not completely isolated from the effects of related factors. Wherever possible,
we have attempted to design our metrics to minimize this interference, and to
emphasize/isolate trends corresponding to the aspect being measured. In other
places we have attempted analyses that take into account major factors
affecting the quantity being measured.
We have measured
performance parameters and have tried to verify our results with documented features
of the OS (for example – kernel buffer sizes) to see if these OS specifications
are actually 'visible' from the application level.
More than to get
absolute numbers, out tests attempt to highlight the way the OS manipulates the
hardware, when different code implementations are used. These observations can
be analysed in terms of efficient software design, to use algorithms that use
the behaviour of the OS to its advantage, or equivalently, that take measures
to avoid common pitfalls.
We have done all our tests with compiler optimization (O3). Wherever we observed anomalies, we re-ran the tests without this optimization to check if the anomalies were due to it. Our idea behind this is that we wanted to measure these performance numbers based on the best possible performance (i.e. with optimization). We are aware of the fact that the effects of compiler optimization will be different for our test code and any application that may be designed keeping our results in mind, and we have tried to reduce this effect by measuring relative performance. We made absolute measurements only for computations like memory / disk accesses and atomic arithmetic operations which were performed with compiler optimization to get figures for best possible performance.
For all tests, the same code was used on Linux and Windows. The “Cygwin” interface was used to translate the Unix kernel calls into equivalent (nearly) functionality on Windows. This does not guarantee an exact functional emulation of the Linux test codes, but is the closest we could get.
Note: In the rest of the report, the terms ‘Linux’ and ‘Windows’ correspond to the specifications mentioned above.
3 Memory
The following measurements were taken to evaluate the effect of memory
access rates, on both Linux and Windows XP.
3.1 Cache Vs RAM Vs Swap Disk
3.1.1 Metric Description
This test was performed to measure the relative memory bandwidth between
the cache, RAM and swap disk.
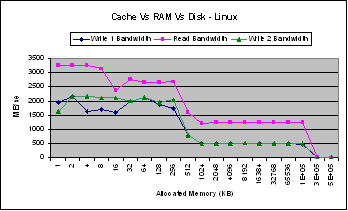
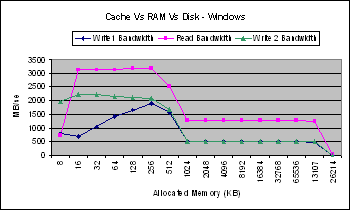
In each run of this experiment a block of memory was allocated and
looped over in a Write-Read-Write sequence. The first set of Writes ensures a
warm-cache. The subsequent Read and Write loops were then timed to measure memory
access times.
|
N= 1000; si=kbsize*1024/sizeof(int); data = (int*)malloc(kbsize*1024); |
/* sequential write */ GetTime(1); for(i=0;i<N;i++) for(j=0;j<si;j++) data[j] = j+i ; writetime1 = GetTime(2); |
/* sequential read */ GetTime(1); for(i=0;i<N;i++) for(j=0;j<si;j++) sum = data[j]; readtime = GetTime(2); free(data); |
Figure 1 : Code Segment for Memory Access
Loops for each type of access (write, read and write) were executed
several times (1000) for chunks of memory ranging in size from 1KB to 512 MB in
steps of powers of 2. The expected result was that there would be a drop in
bandwidth when the memory size exceeds the cache (512KB) and a further drop
beyond the RAM size (256MB).
3.1.2 Results and Analysis
The following graphs were obtained from runs on Linux and Windows.
|
|
|
Figure 2 : Graphs for Memory Access
These graphs clearly show a bandwidth drop at the cache and RAM
boundaries. The RAM bandwidth is approximately 4 times less than the cache
bandwidth for memory writes, and 3 times less than the cache for memory reads. These
ratios are consistent between Linux and Windows.
The average memory bandwidths for the cache, RAM, and Swap Disk were
calculated as follows:
Bandwidth (MB/sec)
= (Memory Chunk Size)/ (Iteration Time over this chunk)
|
Operating
System |
Cache |
RAM |
Swap Disk |
|||
|
|
Write |
Read |
Write |
Read |
Write |
Read |
|
Linux |
2035.709 |
2888.2118 |
527.997 |
1264.58296 |
7.455528 |
12.0370933 |
|
Windows |
2132.011 |
2749.24728 |
563.9692 |
1323.843481 |
2.670522 |
13.10448265 |
Memory bandwidths in MB/seconds were estimated as follows:
The page fault latency between the cache-RAM and RAM-Swap disk can be
estimated from these numbers.
Cache–RAM Page Fault Latency = Average RAM Access Time – Average Cache
Access Time
RAM–Swap Page Fault Latency = Average Swap Disk Access Time – Average RAM
Access Time
Page Fault Latencies in seconds were estimated as follows using ‘read’
times:
|
Operating System
|
Cache-RAM |
RAM-Swap Disk |
|
Linux |
3.088e-6 - 1.352e-6 = 1.736e-6 |
324.57e-6 – 3.088e-6 = 321.482e-6 |
|
Windows |
2.950e-6 – 1.420e-6 = 1.53e-6 |
298.06e-6 - 2.950e-6 = 295.11e-6 |
3.2 Code/Memory Optimizations
3.2.1 Metric Description
This test was done to estimate the size of the code being executed. This was done from observations of memory access times as a function of increasing memory chunk (data) size allocated and looped over by the code. The data size beyond which the memory bandwidth dropped drastically would indicate the point at which the code plus data size exceeds cache size. Since the size of the cache and the size of data allocated are known, this would give an approximation of the amount of cache being used by all current code (plus other cache resident code/buffers).
In this section, the same code as in 3.1 was used with data sizes
ranging from 4KB -1020 KB in steps of 8KB.
Fine sampling was done near the cache size. The expected result is a drop in bandwidth
when the code plus data size exceeds the cache. This was expected to change with different
levels of compiler optimization, as the code would become tighter. The code was
run at different level of optimizations (no opt., O1- O5) to observe this
effect.
Approximate Size
of Code = Cache Size – Memory allocated at the point the bandwidth drops
This “code” size is only an estimate as it will include the test code as
well as any other cache-resident code. The allocated chunks of memory were
therefore looped over 1000 times, to ensure (as much as possible) that the code
and data corresponding only to the test process was resident in the cache.
3.2.2 Results and Analysis
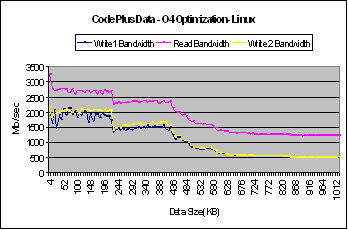
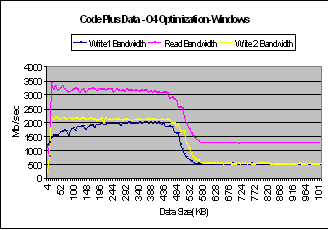
The following graphs were obtained from runs on Linux and Windows with compiler optimization level O4.
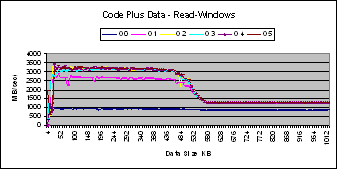
These plots show a large drop in bandwidth between chunk sizes of 400KB to 550KB. This would mean that beyond 400 the resident code and the allocated memory contend for the cache.
|
|
|
Figure 3 : Graph for Memory Access for Code plus Data
The approximate size of the code resident in cache is calculated as
follows:
|
Operating System |
Approximate Code
Size |
|
Linux |
512 – 436 = 76 KB |
|
Windows |
512 – 476 = 36 KB |
The plots for runs at lower levels of optimizations showed noisier behavior within the cache size as compared to higher levels of complier optimization. The graphs for the runs with different levels of optimizations are shown in the Section 7 with further analysis.
3.3 Looping and Sub-Looping
3.3.1 Metric Description
In this experiment we compared the write execution times of repeated
looping over a large chunk of memory (8MB and 32MB) to the times observed by
splitting the chunk into numerous equal pieces and repeatedly looping over them
separately.
This measurement was an attempt to estimate an optimal piece size at
which the execution time is the least. We expected that at some piece size, the
two contending factors of speed due to in-cache looping and overhead due to a
large number of such pieces, would balance out, giving minimum execution time.
Piece sizes ranged from 1KB to 8MB (and 32MB).The execution times while
sub-looping were compared to that for which the piece size was equal to the
total chunk size (Number of pieces =1).This approach could be used to structure
loops efficiently.
|
/*** Looping and Sub-looping ***/ N = 1000; M = 8192; si=kbsize*1024/sizeof(int); data = (int *)malloc(M*1024); /* multiple loops - sequential
write */ temp = (int) (M/kbsize); GetTime(1); |
for(p=0;p<temp;p++) { tp
= p*si; for(i=0;i<N;i++) for(j=0;j<si;j++)data[tp+j]
= j+i ; } multiloop = GetTime(2); free(data); |
Figure 4 : Code Segment for Looping and Sub-Looping
3.3.2 Results and Analysis
The following graphs show the results for Linux and Windows.
|
|
|
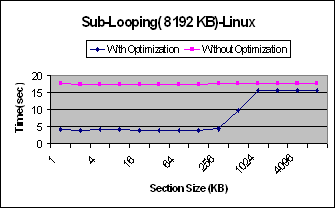
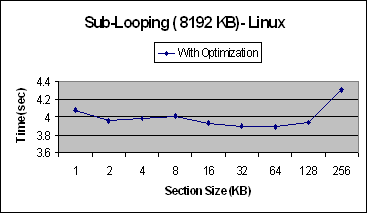
Figure 5 : Graphs for Sub-Looping with 8192KB on Linux
From these graphs we can see that an optimal piece size would be around
64KB. Below 64KB the looping takes
longer, even though the chunks are entirely in the cache. This could be due to
a possible overhead of breaking up the memory chunk into a large number of
small pieces. For pieces larger than the cache size, the write time is
approximately 3 times higher.
This test was done for memory chunk sizes of 8MB and 32MB, to see if
changing the total size of the problem would show different trends. No such
difference was observed, which leads us to conclude that this method of
determining the optimal piece size scales properly with overall problem size.
|
|
|
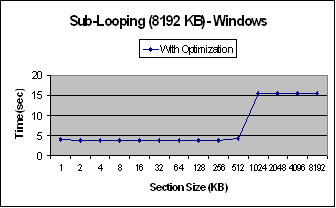
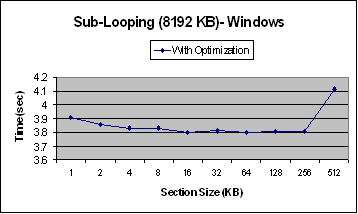
Figure 6: Graphs for Sub-Looping with 8192KB on
Windows
An algorithm that performs a large number of repetitive operations on
large chunks of data, can use this way of probing system characteristics to
dynamically structure its loop structures to optimize for performance. This is
applicable both to computations that involve repetitive operations on large
data sets, as well as complex algorithms that can be broken up into several
algorithmically simpler sub-problems. Such algorithms can be classified as
‘Cache Oblivious Algorithms’ (Ref: [4]) The FFTW and such adaptive algorithms
first probe a system to obtain information about its memory architecture, and
then record these measurements. Any subsequent run of the algorithm uses this
system information to dynamically restructure the block sizes/shapes in a block
decomposed implementation.
4 Disk IO
The following measurements were taken to evaluate disk I/O performance
on both Linux and Windows XP.
4.1 Disk access (read-write-read)
This measurement was performed to evaluate average disk access times for
the system being tested, and to examine the relative disk access times between
reading (from the disk) and writing (to a file on this disk).
Three sets of measurements were made on a 512MB data file (RAM = 256MB),
using 'fread-fwrite' ,'read-write', and 'mmap-munmap', to compare their
relative speeds, given the different buffering schemes used in these
functions/system calls.
The data was accessed from the file in chunks of sizes varying from 1KB
to the size of the file. This was to expose any effects that the chunk size or
the number of such chunk accesses, may have on the disk I/O performance.
For each run sequential reads through this 512MB file, ensures that
reads are always from the disk. This is because of the LRU page replacement
strategy of the OS. Writes are left to perform depending on the buffering
scheme used.
The algorithm involves reading
the contents of a 512MB file piece by piece, changing the data in the memory
and writing it back to the file in pieces, and then reading them again from the
file. The two reads were expected to show slight differences in timings because
of the locality that would inevitably be created by the earlier reads and
writes having transferred the file pages into main memory (either as clean or
dirty pages). Asynchronous and Synchronous access was controlled as described
below.
4.1.1 fopen-fclose-fread-fwrite
4.1.1.1 Metric Description
Stream IO functions were used to test the 'usual' mode of file IO. 'fread'
is always synchronous ( upto the page read-ahead ) but fwrite uses a stream
buffer ( default size 8KB ). The 'setvbuf' function was used to control the
size of this stream buffer, to turn it on and off.
|
/*** DISK - fread ***/ n = NN; // size in KB of target
file nbuff = n/kbsize; buf = atoi(argv[2]); // 1:with
buffering data = (char*)malloc(kbsize*1024); /* read the file */ fp =
fopen("scratchfile","r"); if(buf == 1)
setvbuf(fp,NULL,_IONBF,0); GetTime(1); for(i=0;i<nbuff;i++) fread(data,sizeof(char),kbsize*1024,fp); readtime1 = GetTime(2); fclose(fp); for(i=0;i<kbsize*1024;i++) data[i]= i % 250; |
/* write the file */ fp =
fopen("scratchfile","r"); if(buf ==
1)setvbuf(fp,NULL,_IONBF,0); GetTime(1); for(i=0;i<nbuff;i++) fwrite(data,sizeof(char),kbsize*1024,fp); writetime = GetTime(2); fclose(fp); /* read the file */ fp =
fopen("scratchfile","r"); if(buf ==
1)setvbuf(fp,NULL,_IONBF,0); GetTime(1); for(i=0;i<nbuff;i++) fread(data,sizeof(char),kbsize*1024,fp); readtime2 = GetTime(2); fclose(fp); free(data); |
Figure 7 : Code Segment for Disk Access using 'fread' and 'fwrite'
4.1.1.2 Results and Analysis
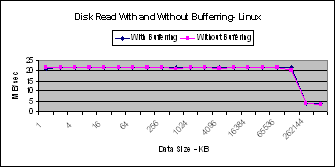
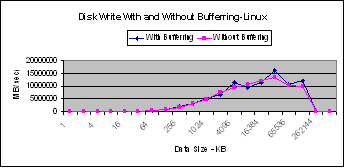
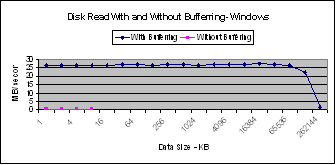
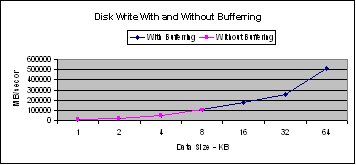
Data sets were recorded with and without (default) stream buffering. The
results are as follows.
|
|
|
Figure 8 : Graphs for Disk Read And Write Access on Linux
The average disk access time per KB for Linux is 45.142e-6 seconds and
for Windows 36.558e-6 seconds. (1/ Average Read Bandwidth)
For Linux, the performance of ‘fread’ appeared to be constant with and
without stream buffering up to a user buffer size equal to the RAM size. This
could be because the default stream buffer size is only 8 KB. The drop beyond
the RAM is expected, since at this size, the data is repeatedly swapped to disk.
The ‘fwrite’ performance increases as a function of the user buffer size
up to the size of the RAM. The writes without buffering are only slightly
slower.
|
|
|
Figure 9 : Graphs for Disk Read And Write Access on
Windows
On Windows, there is a drastic difference for ‘fread’ with and without
stream buffering. Only a small sample has been taken on Windows without stream
buffering because each run was taking approximately 27 minutes.
4.1.2 open-close-read-write
4.1.2.1 Metric Description
System calls to manipulate files via file descriptors were used to test
file IO without the overhead of stream buffering, and with the option of
forcing synchronous writes (via the O_SYNC flag in 'open'). These forced
synchronous writes are to ensure that the file pages are cleaned and written to
disk.
Data sets were recorded with and without the O_SYNC flag, corresponding
to synchronous and asynchronous IO respectively.
|
/******** READ-WRITE *****/ n = NN; // size in KB of target
file nbuff = n/kbsize; data = (char*)malloc(kbsize*1024); /* read the file */ if(buf == 1)fd =
open("scratchfile",O_RDWR|O_SYNC); else fd =
open("scratchfile",O_RDWR); GetTime(1); for(i=0;i<nbuff;i++) read(fd,data,kbsize*1024); readtime1 = GetTime(2); close(fd); for(i=0;i<kbsize*1024;i++)
data[i]= i % 250; |
/* write the file */ if(buf == 1)fd =
open("scratchfile",O_RDWR|O_SYNC); else fd =
open("scratchfile",O_RDWR); GetTime(1); for(i=0;i<nbuff;i++) write(fd,data,kbsize*1024); writetime = GetTime(2); close(fd); /* read the file */ if(buf == 1)fd =
open("scratchfile",O_RDWR|O_SYNC); else fd =
open("scratchfile",O_RDWR); GetTime(1); for(i=0;i<nbuff;i++) read(fd,data,kbsize*1024); readtime2 = GetTime(2); close(fd); free(data); |
Figure 10 : Code Segment for Disk Access using 'open'
and 'close'
4.1.2.2 Results and Analysis
|
|
|
Figure 11 : Graphs for Disk Read And Write Access on Linux
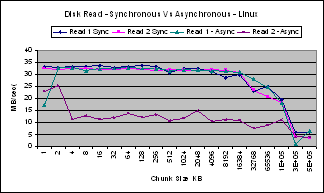
For Linux, Synchronous reads (Read 1 and Read 2) show similar trends as
reads are always from the disk. In the case of asynchronous reads the first
read (Read 1) is from the disk and hence follows the curve for synchronous
reads. The second read (Read 2), appears much slower. This could be explained
due to the fact that the asynchronous writes do not always write to the disk,
thus filling up the RAM with dirty pages. The writes will be written to disk
only when the dirty pages exceed the size of the RAM. A subsequent read, will
then have to first clean the pages in the RAM by writing them to disk and then
read in fresh data from the disk (which had been written to disk during the
write - LRU).
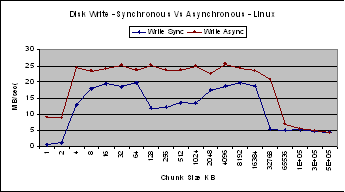
Synchronous writes show a lower bandwidth compared to asynchronous
writes since the synchronous writes ensures that the data is written to disk
and not stored in the RAM as dirty pages.
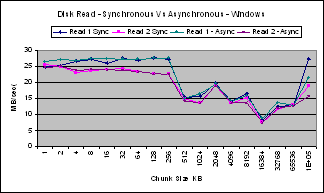
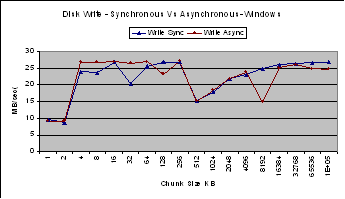
The corresponding measurements for Windows show no such differences
between synchronous and asynchronous disk access. This could be due to the fact
that the ‘cygwin’ environment on Windows may not be able to correctly translate
the O_SYNC flag used in the read and write system calls. The reads on Windows
however show a drop in throughput at the cache size.
|
|
|
Figure 12 : Graphs for Disk Read And Write Access on
Windows
4.1.3 mmap-msync-mmap
4.1.3.1 Metric Description
Kernel calls that manipulate virtual memory were used to measure disk
access times (without the data copying overhead of fread and read which copy
from system buffers into user buffers). Mapping chunks of memory does not load
file pages. Accessing them by dereferencing, triggers loads from the disk into
the physical memory. 'msync' and 'munmap' were used to ensure that the data
written to the mapped areas are synchronously written to the disk.
|
/****** MMAP *******/ /* read the file */ fd =
open("scratchfile",O_RDWR); GetTime(1); for(i=0;i<nbuff;i++) { startaddress=mmap(0,kbsize*1024,PROT_READ| PROT_WRITE,MAP_SHARED,fd,0); for(j=0;j<kbsize*1024;j++)data[j]=*((char*)(startaddress)+j); err = munmap(startaddress,kbsize*1024); lseek(fd,kbsize*1024,SEEK_CUR); } readtime1 = GetTime(2); close(fd); for(i=0;i<kbsize*1024;i++)
data[i]= i % 250; /* write the file */ fd =
open("scratchfile",O_RDWR); GetTime(1); for(i=0;i<nbuff;i++) { startaddress = mmap(0,kbsize*1024,PROT_READ| PROT_WRITE,MAP_SHARED,fd,0); |
for(j=0;j<kbsize*1024;j++) *((char*)startaddress + j) = data[j]; err =
munmap(startaddress,kbsize*1024); lseek(fd,kbsize*1024,SEEK_CUR); } writetime = GetTime(2); close(fd); /* read the file */ fd =
open("scratchfile",O_RDWR); GetTime(1); for(i=0;i<nbuff;i++) { startaddress=mmap(0,kbsize*1024,PROT_READ| PROT_WRITE,MAP_SHARED,fd,0); for(j=0;j<kbsize*1024;j++)
data[j]= *((char*)startaddress + j); err =
munmap(startaddress,kbsize*1024); lseek(fd,kbsize*1024,SEEK_CUR); } readtime2 = GetTime(2); close(fd); free(data); |
Figure 13 : Code Segment for Disk Access using 'mmap'
and 'munmap'
4.1.2.2 Results and Analysis
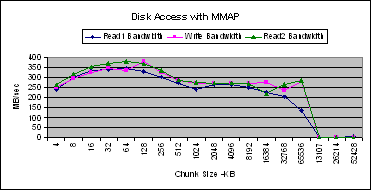
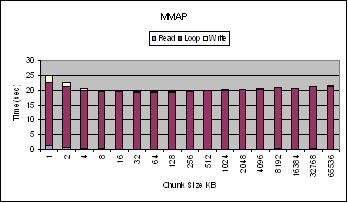
The average disk access time per KB is approximately 2.579e-6 seconds.
Both reads and writes using ‘mmap/munmap’ always access the disk when
dereferencing the data. This is why the read and write curves show similar
trends. There is a performance peak when the chunk sizes are just below the
size of the cache (512 KB). This could be due to the fact that the size of the
user buffers into which the data is being read is small enough to fit in the
cache and large enough to amortize the overhead of having to read a larger
number of smaller chunks.
|
|
Figure 14 : Graph for Disk Access using 'mmap' and
'munmap'
There is rise in performance at chunk sizes just larger than the cache
and this dips slightly as the data size approaches the RAM size. This could be
due to a similar effect as the hump observed just before the cache size, which
would indicate a balance point between user buffer size approaching that of the
RAM, and the advantage of keeping it entirely in the RAM.
These three measurements demonstrate the differences in cost incurred
with the use of different file access mechanisms. Depending on the application
being designed, if file IO is a dominant feature, the choice of an appropriate
file access mechanism would give substantial benefit.
Note : On WinXP we could only perform the tests with
'fopen-fclose-fread-fwrite' and ‘open-close-read-write’. ‘mmap’ did not
work - not possible to support it via cygwin.
4.2 Sequential Vs Random Reads
4.2.1 Chunk Sizes in powers of 2
4.2.1.1 Metric Description
This test was performed to compare times for sequential and random disk
access (read), keeping in mind factors like page read-ahead and physical
proximity on the disk.
|
/*******SEQ_RAN *******/ /* read the file = random */ GetTime(1); for(i=0;i<nbuff;i++) { off =
(int)((double)abs(rand())/RAND_MAX*(nb-1)*kbsize*1024); } rant = GetTime(2); /* random seeks are NOT to page
boundaries.. */ fd =
open("scratchfile",O_RDWR|O_SYNC); GetTime(1); for(i=0;i<nbuff;i++) { off =
(int)((double)abs(rand())/RAND_MAX*(nb-1)*kbsize*1024); lseek(fd,off,SEEK_SET); read(fd,data,kbsize*1024); } |
rantime = GetTime(2) - rant; close(fd); /* read the file - sequential */ fd =
open("scratchfile",O_RDWR|O_SYNC); off=0; GetTime(1); for(i=0;i<nbuff;i++) { lseek(fd,0,SEEK_CUR); read(fd,data,kbsize*1024); } seqtime = GetTime(2); close(fd); free(data); |
Figure 15 : Code Segment for Sequential and Random Disk Access
The fixed size 512MB data file was used and the data was read in
different sized chunks as before (1KB to the file size). This was to attempt to
bring out the effects of chunk size versus the number of such chunks read, on
sequential and random access patterns. The number of such chunks depended on
the size of each chunk, each sequential run reading through the entire 512MB
data file. The same number of random chunk accesses were timed. (This makes is
a pseudo-random access pattern, since although the beginning of the blocks are
chosen at random, the data in each chunk is read sequentially. The same number
of such chunks were read sequentially and randomly.
4.2.1.2 Results and Analysis
|
|
|
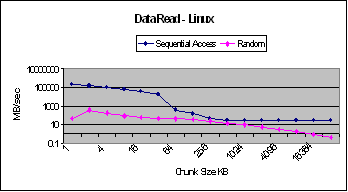
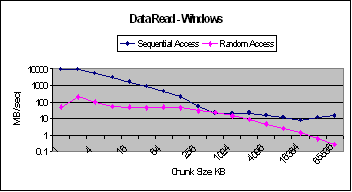
Figure 16 : Graphs for Sequential and Random Disk Access
on Linux and Windows
As expected the overall trends showed better performance for sequential
access compared to random access.
At chunk sizes smaller than the cache (512KB), both type of accesses loop
within the cache and the dominant reason for the difference in performance
would be the overhead for random disk access. However, the performance seems to
decrease with increasing chunk size, something not observed in the other file
access tests which did not sample the curve finely.
However for chunk sizes around the size of the cache (256KB – 1MB), the
sequential and random accesses show similar performance. The minimum distance
between the two curves occurs at the cache size of 512KB. This could the result
of the two interacting factors of “Cache Vs RAM memory access” and “Sequential
Vs Random” disk access. The sequential access shows an expected performance
drop at the file cache size. One point to note is that at larger chunk sizes,
the number of chunks being read decreases, and this decreases the degree of
randomness.
For chunk sizes beyond the size of the cache, the difference is mainly because
of the two varying access patterns. They do not differ as much as below the
cache size, since this degree of randomness has also decreased. (Note: All timings
were for reading a fixed total amount of data from the disk – 512MB.)
This can also be understood from the fact that Somehow this results in
similar performance of both
Similar trends are observed for Windows too. We have not yet been able
to devise a plausible explanation for this trend.
4.2.2 Page Read Ahead
4.2.2.1 Metric Description
We ran another test, using chunk sizes ranging from 1KB to 128KB. This was an attempt to see at what chunk size the trend changes, indicating the limit of the advantages of the page read-ahead.
4.2.2.2 Results and Analysis
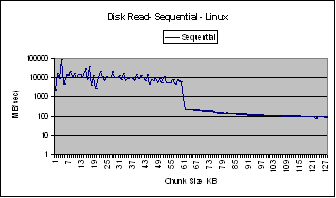
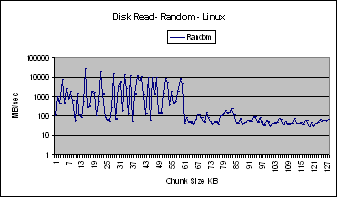
For Linux, the sequential access performance is an order of magnitude
higher than that for random access. Also the random access bandwidths are
noisier than sequential because of different access patterns. Both however show
a drop in bandwidth between chunk sizes of 60 – 65 KB.
|
|
|
Figure 17 : Graphs for Sequential and Random Disk
Access on Linux to determine Page Read Ahead Size
Below the cache size, the performance of sequential access is an order
of magnitude higher than random, but beyond approximately 64KB, the bandwidths
for both sequential and random are at the same order of magnitude (except for
the noise due to the random access pattern). This suggests that no more
performance gains are visible due to the page read-ahead, and both sequential
and random disk access have comparable performance.
|
|
|
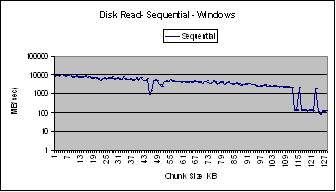
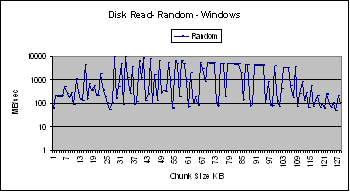
Figure 18 : Graph for Sequential and Random Disk
Access on Windows to determine Page Read Ahead Size
This could give an estimate of the page read ahead employed by the
operating system. For a page size of 4 KB , this would correspond to a read
ahead of 16 pages (64/4) on Linux. This would be the combined effects of page read-ahead buffering at different
levels.
We saw no such trends for Windows except for the fact that the
sequential access was an order of magnitude better than random access and less
noisy.
4.3 Read Vs mmap
4.3.1 Metric Description
This test was done to compare the collective operation of file access (
read the file in chunks ‘read’, change data in each chunk ’loop’ and write it
back to disk synchronously ‘write’ ) using 'read-write' and 'mmap-munmap'. In
both cases timings were obtained for the 'read', 'loop' and 'write' phases and
compared.
|
/**** READ Vs MMAP ****/ /* Get timing for GetTime !!! */ tread=0;tloop=0;twrite=0; gtime = GetTime(3); for(i=0;i<nbuff;i++) { GetTime(1); tread
+= GetTime(2); GetTime(1); tloop
+= GetTime(2); GetTime(1); twrite
+= GetTime(2); } gtime = GetTime(3) - gtime; printf("bufsize= %d KB nbuff= %d
timers= %10.9lf" ,kbsize,nbuff,gtime); /* Read and Write the File using
mmap,munmap */ tread=0;tloop=0;twrite=0; fd =
open("scratchfile",O_RDWR|O_SYNC); mmaptime = GetTime(3); for(i=0;i<nbuff;i++) { GetTime(1); startaddress =mmap(0,kbsize*1024,PROT_READ|
PROT_WRITE,MAP_SHARED,fd,0); tread += GetTime(2); GetTime(1); for(j=0;j<kbsize*1024;j++)
*((char*)(startaddress)+j) = ((*((char*)(startaddress)+j))+5)%250; tloop += GetTime(2); |
GetTime(1); err =
munmap(startaddress,kbsize*1024); lseek(fd,kbsize*1024,SEEK_CUR); twrite += GetTime(2); } mmaptime = GetTime(3) - mmaptime; close(fd); printf("mmaptotal=
%10.9lf mprd= %10.9lf mlp= %10.9lf mwr= %10.9lf ",mmaptime,tread,tloop,twrite); /* Read and Write the File using
read,write */ tread=0;tloop=0;twrite=0; fd =
open("scratchfile",O_RDWR|O_SYNC); off=0; readtime = GetTime(3); for(i=0;i<nbuff;i++) { GetTime(1); read(fd,data,kbsize*1024); tread
+= GetTime(2); GetTime(1); for(j=0;j<kbsize*1024;j++)
data[j]=(data[j]+5)%250; tloop
+= GetTime(2); GetTime(1); lseek(fd,-1*kbsize*1024,SEEK_CUR); write(fd,data,kbsize*1024); twrite
+= GetTime(2); } readtime = GetTime(3)-readtime; close(fd); free(data); |
Figure 19 : Code Segment for 'read' Vs 'mmap'
4.3.2 Results and Analysis
|
|
|
Figure 20 : Graphs for Disk Access using 'read' and 'mmap'
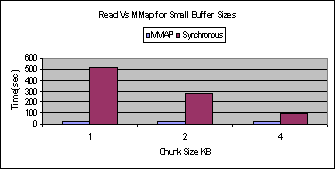
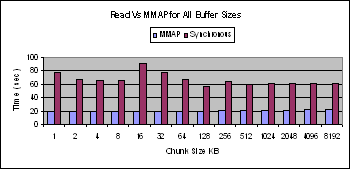
As seen from these graphs, synchronous file access using mmap is much
faster than when using ‘read’ and ‘write’ system calls. This is due the
overhead of copying data into user buffers while using ‘read’ and ‘write’.
|
|
|
Figure 21 : Individual graphs for 'mmap' and normal '
read-write'
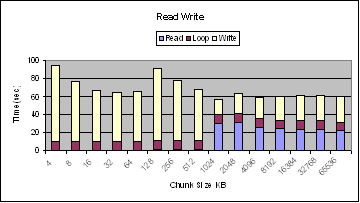
The above plots show the break-up of the read, loop, and write phases
for the two access methods.
Note : The two plots have different scales, so for clarity, we have
included the numbers in a table below.
The following analysis compares the ‘read’, ’loop’, and ‘write’ phases
of the two implementations.
The reading using 'read' is slower because of the extra copy into the
user buffer. The reading using 'mmap' is much faster since only page table
entries are modified to include the new mapped region of virtual memory - no
pages are loaded from the disk. ‘read’ timings for chunk sizes smaller than the
cache, is much less than for larger chunk sizes.
The looping using 'read' is faster because the array being looped over
is already in the memory. The looping using 'mmap' is much slower because this
is when the pages get loaded into the physical memory, read and modified. (mmap
loads pages only when the corresponding addresses are dereferenced.)
The writing using 'write' is slower because it copies from the user
buffer to the system buffer and then to disk ( forced synchronous – O_SYNC).
The writing using 'munmap' is faster because the dirty pages are written to
disk without any extra buffer copies.
|
Buffer Size (KB) |
MMAP Total (sec) |
MMAP Read (sec) |
MMAP |
MMAP Write (sec) |
RW Total (sec) |
Read(sec) |
|
Write(sec) |
|
1 |
26.487 |
1.340 |
21.289 |
2.257 |
519.436 |
2.429 |
9.949 |
504.905 |
|
2 |
23.216 |
0.682 |
20.569 |
1.138 |
280.510 |
1.241 |
9.690 |
268.498 |
|
4 |
20.890 |
0.359 |
19.559 |
0.567 |
95.227 |
1.030 |
9.676 |
83.976 |
|
8 |
20.080 |
0.180 |
19.397 |
0.291 |
77.656 |
0.912 |
9.645 |
66.823 |
|
16 |
19.713 |
0.091 |
19.360 |
0.148 |
67.543 |
0.853 |
9.671 |
56.871 |
|
32 |
19.543 |
0.042 |
19.352 |
0.089 |
65.375 |
0.893 |
9.672 |
54.735 |
|
64 |
19.466 |
0.022 |
19.362 |
0.047 |
65.755 |
0.971 |
9.609 |
55.134 |
|
128 |
19.447 |
0.013 |
19.380 |
0.030 |
90.765 |
1.288 |
9.720 |
79.725 |
|
256 |
19.604 |
0.009 |
19.561 |
0.026 |
77.520 |
1.802 |
9.763 |
65.935 |
|
512 |
19.992 |
0.011 |
19.928 |
0.048 |
67.992 |
2.339 |
9.626 |
56.015 |
|
1024 |
20.086 |
0.007 |
20.012 |
0.064 |
57.188 |
30.655 |
9.849 |
16.678 |
|
2048 |
20.147 |
0.004 |
20.063 |
0.078 |
63.309 |
31.656 |
9.780 |
21.870 |
|
4096 |
20.255 |
0.002 |
20.175 |
0.076 |
59.698 |
25.563 |
9.776 |
24.357 |
|
8192 |
20.787 |
0.394 |
20.325 |
0.066 |
60.346 |
24.324 |
9.771 |
26.251 |
|
16384 |
20.554 |
0.008 |
20.481 |
0.065 |
62.089 |
23.913 |
9.763 |
28.412 |
|
32768 |
21.191 |
0.404 |
20.723 |
0.064 |
61.896 |
23.766 |
9.833 |
28.297 |
|
65536 |
21.322 |
0.000 |
21.253 |
0.069 |
60.677 |
22.124 |
9.775 |
28.778 |
Figure 22 : Table for read and mmap timings
4.4 Remote File Access
4.4.1 Metric Description
This test was done to get an estimate of the overhead involved in
accessing a file on a remote disk (nfs mount), as compared to accessing a file
on a locally mounted disk (/tmp). This test was performed only on Linux, and on
a different machine connected to a network with remotely mounted disks.
A file was created by performing write operations in different sized chunks.
Different test runs were performed with this file being created on a local disk
(/tmp) and on a remotely mounted disk. These writes use the ‘write’ system call with
the O_SYNC flag set to force synchronous writes for each instance of the user
buffer.
|
/*******SEQ_RAN *******/ /* read the file = random */ GetTime(1); for(i=0;i<nbuff;i++) { off =
(int)((double)abs(rand())/RAND_MAX* (nb-1)*kbsize*1024); } rant = GetTime(2); /* random seeks are NOT to page
boundaries.. */ fd =
open("scratchfile",O_RDWR|O_SYNC); GetTime(1); for(i=0;i<nbuff;i++) { off =
(int)((double)abs(rand())/RAND_MAX* (nb-1)*kbsize*1024); lseek(fd,off,SEEK_SET); read(fd,data,kbsize*1024); } |
rantime = GetTime(2) - rant; close(fd); /* read the file - sequential */ fd = open("scratchfile",O_RDWR|O_SYNC); off=0; GetTime(1); for(i=0;i<nbuff;i++) { lseek(fd,0,SEEK_CUR); read(fd,data,kbsize*1024); } seqtime = GetTime(2); close(fd); free(data); |
Figure 23 : Code Segment for Local and Remote Disk
Access
4.4.2 Results and Analysis
|
|
|
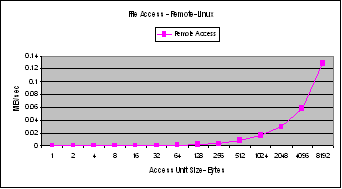
Figure 24: Graphs for Local and Remote Disk Access
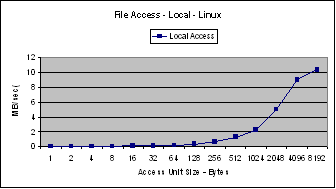
The overall file access bandwidth for the remote disk is two orders of
magnitude lower than that for the local disk.
This is due to the network overhead.
Also – the bandwidth in both cases increases exponentially with chunk
size, which is an indication of lesser number of packets being transferred.
(these writes are synchronous)
Data transfer rates plus timings for file creation using a chunk size of
64 bytes is estimated from the remote access time, as 63.52 milliseconds.
Data transfer rate calculated from ‘ping’ statistics, which includes the
overhead due to the network protocol layers is observed to be 0.207
milliseconds. These measurements were done over a 100Mbps Ethernet link.
5 Processes
The
following tests were run on Linux and Windows to measure the absolute times to
perform system calls, as well as the relative costs incurred between executing
a function in different contexts (within the same process vs forking a new
process).
5.1 System Calls
5.1.1 Metric Description
The
following functions were called repeatedly and the number of possible calls per
second was calculated. This gives an approximate absolute value of the overhead
of performing these functions. These timings including looping overhead
required to perform several repetitions.
'getpid()' being the
simplest available kernel call, was used to give an approximate overhead of a
kernel function call.
'malloc-free' were used to
allocate/deallocate 4 bytes of memory repeatedly to calculate approximate
overhead of memory allocation.
'file open-close' were used to
measure the time overhead involved in the process of opening and closing an
existing file.
'file
create-delete' overhead was measured by performing the test of file open-close,
but always creating a new file and deleting it after closing.
'fork' was used to give
an approximate overhead of procedure invocation.
/*** Process - getpid -
openclose...malloc... ***/
|
/* Call getpid() */ GetTime(1); for(i=0;i<N/100;i++) getpid(); difftime = GetTime(2); /* File Open Close - fopen-fclose
*/ fp=fopen("temp","w"); fclose(fp); GetTime(1); for(i=0;i<N/100;i++) { fp=fopen("temp","w"); fclose(fp); } difftime = GetTime(2); /* File Open Close - open-close */ GetTime(1); |
for(i=0;i<N/100;i++) { fd=open("temp",O_RDWR |O_SYNC|O_CREAT); close(fd); } difftime = GetTime(2); /* File Create Delete */ GetTime(1); for(i=0;i<N/100;i++) { fd=open("temp",O_RDWR|O_SYNC|O_CREAT); close(fd); unlink("temp"); } difftime = GetTime(2); |
/* mem malloc free */ GetTime(1); for(i=0;i<N/10;i++) { data=(int*)malloc(4); free(data); } difftime = GetTime(2); /* forking */ GetTime(1); for(i=0;i<N/1000;i++) { ferr=fork(); if(ferr==0)exit(0); else
wait(&stat); } difftime = GetTime(2); |
Figure 25 : Code Segment for System Calls
5.1.2 Results
|
|
Linux |
Windows |
|||
|
With
Optimizations (Million
Calls/sec) |
Without
Optimizations (Million
Calls/sec) |
Without
Optimizations (Million
Calls/sec) |
Without
Optimizations (Million
Calls/sec) |
||
|
Call |
Getpid |
1.486661667 |
1.466027333 |
125 |
42.65089633 |
|
File |
Open-Close-fopen-fclose |
0.094614333 |
0.073689667 |
0.004799 |
0.057701 |
|
File |
Open-Close-open-close |
0.389528 |
0.387609 |
0.007438 |
0.261525 |
|
File |
Create- Delete |
0.055121333 |
0.04593 |
0.002204 |
0.034418444 |
|
Malloc |
Free |
11.692463 |
9.627664667 |
1.297353 |
7.539160222 |
|
Process |
Fork |
0.003328667 |
0.00332 |
0.000101 |
0.002249889 |
Figure 26 : Table of performance of system calls
5.2 Function performance with different implementation styles.
5.2.1 Metric Description
This
test involved timing different implementations of functionally identical code.
The code consists of an inner and outer ‘for’ loop, which has been implemented
as inline code, repeated function calls, recursion, and forking child processes
that executed the inner loop. The different implementations were proved to be
functionally identical, by calculating a sum as a by-product of the nested
looping, and making sure that all implementations returned identical sums.
We
tried to ensure that the compiler optimization does not override our attempts
to measure the time differences, by ensuring reuse of variables that get
changed inside the loops. Our goal here was not to time the actual function
invocation or forking times, but to measure the relative execution times for different
implementations of the same functionality.
(i) Inline
There were a simple pair of nested loops in
the main(), with sums being calculated within the inner loop and accumulated in
the outer loop. (The malloc is redundant in all these tests since the
malloc-free operations are always performed within the same scope)
(ii) Function Call
The outer loop was in the main() while the
rest of the computation was performed as a function call. The overhead incurred
here is the cost of 'ntimes' function calls.
(iii) Recursion
The outer loop corresponds to stepping down
through the recursion, and the inner loop was implemented on the unwinding.
This corresponds to a recursion that was 'ntimes' levels deep.
(iv) Forking
The outer loop was in the main() while the
inner loop computation was done in a child process. The child process would
only perform the inner loop computation, send a return value (partial sum) to
the parent process by writing an integer into a system pipe and terminate using
exit(0).The parent would wait for the child to terminate, and after executing
'wait(&stat)' it would read the integer from the pipe and continue the
outer loop. The 'wait()' was required to ensure that the process table entries
for the child processes were deleted and did not remain as zombie processes.
|
/*** Process - inline vs fn vs
recursion vs fork ***/ /* Inline */ GetTime(1); for(i=0;i<ntimes;i++) { sum=0; data =
(int*)malloc(sizeof(int)*size); for(j=0;j<size;j++) data[j] = j; for(j=0;j<size;j++)
{
data[j] = data[j] + i+j;
sum += data[j]; } free(data); sum += sum; } inlinetime=GetTime(2); /* Function calls */ tsum=0;sum=0; GetTime(1); for(i=0;i<ntimes;i++) tsum +=
testfn(i); fntime=GetTime(2); int testfn(int i) { int sum=0,j; int *data=NULL; sum=0; data =
(int*)malloc(sizeof(int)*size); for(j=0;j<size;j++) data[j] = j; for(j=0;j<size;j++) { data[j]
= data[j] + i+j; sum
+= data[j]; } free(data);return(sum); } |
/* Recursive Calls */ tsum=0;sum=0; GetTime(1); tsum = testrec(ntimes-1); rectime=GetTime(2); int testrec(int i) { int *data=NULL; int j,tsum=0,sum=0; if(i>0) tsum = testrec(i-1); data =
(int*)malloc(sizeof(int)*size); for(j=0;j<size;j++) data[j] = j; sum=0; for(j=0;j<size;j++) { data[j]
= data[j] + i+j; sum
+= data[j]; } free(data); tsum += sum; return(tsum); } |
/* Forking ! */ err = pipe(fildes); tsum=0;sum=0; GetTime(1); for(i=0;i<ntimes;i++) {
ferr=fork();
if(ferr<0) printf("err = %d
\n",ferr);
if(ferr==0)
{
sum=0;
data=(int*)malloc(sizeof(int)*size);
for(j=0;j<size;j++) data[j] = j;
for(j=0;j<size;j++) { data[j]
= data[j] + i+j; sum
+= data[j]; }
free(data);
write(fildes[1],&sum,sizeof(int));
exit(0);
} else {
wait(&stat);
read(fildes[0],&sum,sizeof(int));
tsum += sum; } } forktime=GetTime(2); |
Figure 27 : Code Segment for different call types
3.3.2 Results and Analysis
The
following graphs shows the results for Linux and Windows
These
plots show the execution times for the different implementations as a function
of the number of iterations/fn calls/recursion levels/processes forked.
|
|
|
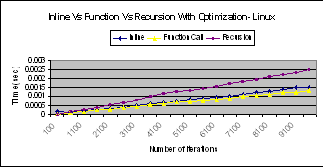
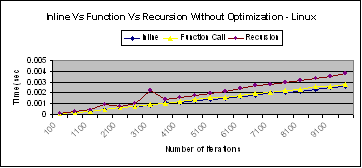
Figure 28 : Graphs for Inline Vs Function Vs Recursion calls on Linux
All three implementation schemes scale linearly with the number of repetitions. The larger slope of the line for recursion indicates it does not scale as well as the inline and function implementations.
An interesting observation is that without compiler
optimization the inline implementation was faster than function calls. But with
compiler optimization (O3) the function call implementation ran faster than the
optimized inline code!
|
|
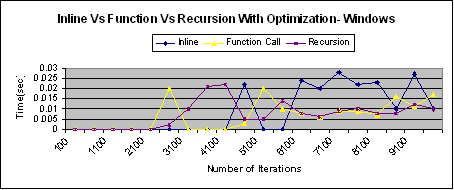
Figure 29 : Graph for Inline Vs Function Vs Recursion on Windows
No
such linear trends were observed for the different implementations on Windows
beyond a certain number of repetitions. This could be attributed to the
‘cygwin’ environment on which the tests were run.
|
|
|
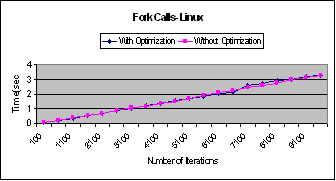
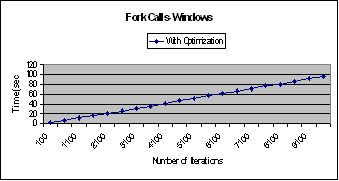
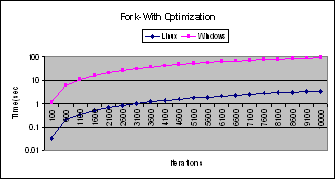
Figure 30 : Graphs for Forks
For Linux, the fork implementation showed no difference with
and without optimization. For Linux and Windows, the performance scales
linearly.
6 Arithmetic Operations
This test measures the number of integer or float operations that can be
done in a second. Another test compares the execution time of integer
operations with and without optimizations.
6.1 Integer and Float Operations
6.1.1 Metric Description
Integer and float arithmetic operations of addition,
subtraction, multiplication and division were tested in this experiment.
Each operation was executed in a “for” loop with the operation being performed once per iteration. N iterations of these loops were timed. These timings include the looping overhead (mainly an increment and a compare operation), which is common to all the tests, and hence can be ignored if only a pure comparison is being made. O4 compiler optimization was used to ensure that while the iterations executed, all values stayed in the registers. This would isolate the test from the overheads of memory accesses.
The loops were structured as shown below, with all variables
declared as integers (or floats). N is always declared as an integer. Several
runs were taken and the average execution time was used to calculate the
approximate number of iterations executed per second.
|
/*** Sample Arithmetic Operation Test.
***/ N=100000000; /*
Integer Addition */ GetTime(1); for(i=0;i<N;i++) acc
= i + inc; difftime
= GetTime(2); printf("Int
Add %lf
MOps/sec\n",N/(difftime*1e+6)); |
Figure 31 : Code Segment for Arithmetic Operations
6.1.2 Results and Analysis
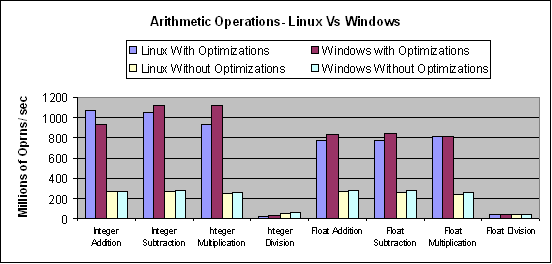
|
|
Figure 32 : Graphs for Arithmetic Operations
These numbers show us that overall, integer operations are faster than
float operations. Operations speed up with compiler optimization, with the
exception of integer division. Windows and Linux gave comparable numbers for
all these tests.
7 Linux Vs Windows
In this section, the performance of Linux and Windows are
compared for the same measurements of memory access, disk access and processes.
Please note that Windows measurements were done on ‘cygwin’ environment which
might attribute to some unexpected results. The same compiler was used for
compiling the programs for the test. One thing that can be noted for memory and
disk performance is that Windows seems to use the cache more effectively than
Linux.
7.1 Memory
Memory – Cache Vs
RAM Vs Swap Disk
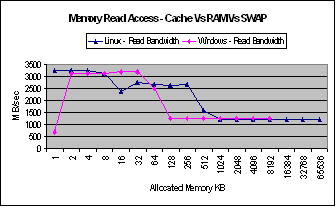
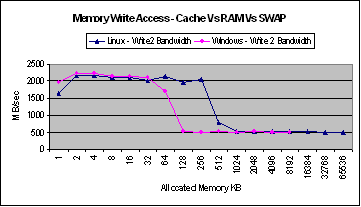
As excepted there is a considerable drop in bandwidth for both memory read and write for both Linux and Windows when the size of the allocated memory is nearly the same as the cache size. In both cases of read and write the bandwidths of Windows drops much earlier than Linux.
|
|
|
Figure 33 : Graphs comparing Linux and Windows memory
access bandwidths
Code Plus Data –
Different Levels of Optimizations
Effects of Code Optimization on Cache Vs RAM memory access times
In our test for comparing memory access times between the cache, RAM and
the disk, and for estimating the cache-resident code size, different levels of
compiler optimization showed different trends. This is shown in the following
plots.
|
|
|
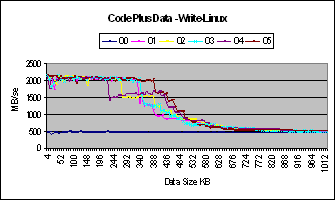
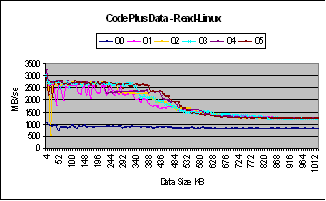
Figure 34 : Graphs for Code plus data with different
levels of optimization on Linux
|
|
|
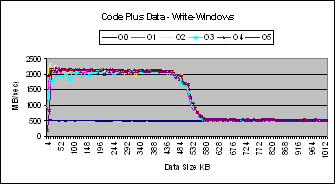
Figure 35 : Graphs for Code plus data with different levels of optimization on Windows
From these plots it can be seen that without compiler optimization,
there is no apparent difference in performance between the cache and the RAM.
With any level of optimization, this divide is apparent. At lower levels of
optimization, the performance curves are noisier than those for higher levels
of optimizations. This is an indication of the fact that the code gets more
compact with higher levels of optimization, thus resulting in less contention
between the cache and the RAM and hence smoother trends.
|
|
|
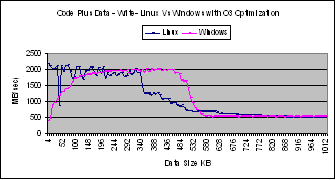
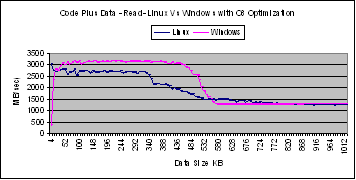
Figure 36 : Graphs comparing Linux and Windows with O3 optimization level
The same compiler was used on both Linux and Windows and a rather consistent feature observed is that the Windows curves were smoother at the cache size and did not start decreasing much before the cache size, as was observed for Linux.
Looping and
Sub-Looping
|
|
|
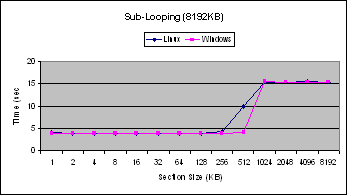
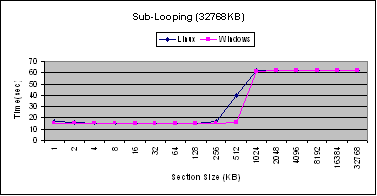
Figure 37 : Graphs comparing the Sub-Looping between Linux and Windows
These graphs show that performance of Linux and Windows are comparable for this experiment. The main difference is that the performance of Linux degrades before the chunk size is equal to the size of the cache. This could be due to the presence of other resident code in the Linux cache.
7.2 Disk IO
open-close-read-write
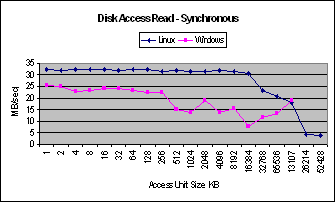
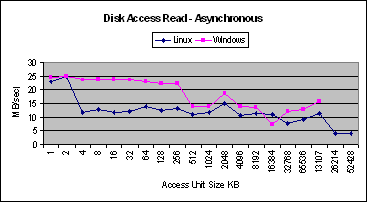
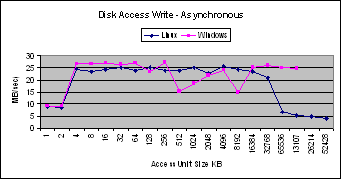
The performance of synchronous and asynchronous reads are different for Linux and Windows.
In the case of synchronous reads, Linux performs better than Windows. The bandwidth of Linux drops way beyond the size of the cache while there is drop in bandwidth for Windows at this point.
Windows performs better than Linux for asynchronous reads. The bandwidth for Linux drops considerably before the size of the cache, while Windows bandwidth drops around this point.
|
|
|
Figure 38 : Graphs comparing disk read bandwidths for Linux and Windows
The reads using synchronous I/O definitely show better performance.
|
|
|
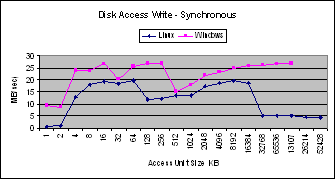
Figure 39 : Graphs comparing disk write bandwidths for Linux and Windows
The performance for synchronous and asynchronous writes are comparable for Linux and Windows.
The bandwidth for synchronous writes drops for Windows at the cache size while that for Linux drops before the cache size. Windows performs better than Linux for synchronous writes at any size. Beyond the size of the cache, the performance of Windows continues to prove while that of Linux goes down.
The performance of asynchronous writes for Linux and Windows are comparable except when there is a drop in bandwidth for Windows at the cache size.
Sequential Vs
Random
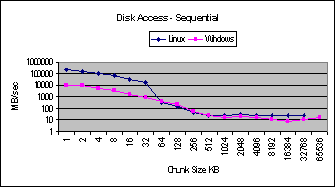
The performance of Sequential access for Linux is better than Windows
for chunk sizes less than 64 KB. Beyond this size the sequential access bandwidths
for both Linux and Windows are comparable.
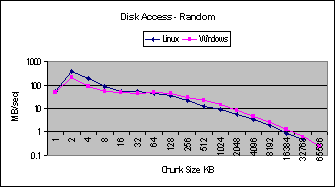
The random access is similar for both Linux and Windows for all chunk
sizes. For chunk sizes less than 64 KB, Linux performs better than Windows and
vice versa for chunk sizes greater than 64KB.
|
|
|
Figure 40 : Graphs comparing Sequential and Random
disk access between Linux and Windows
Sequential and
Random For Page Read Ahead
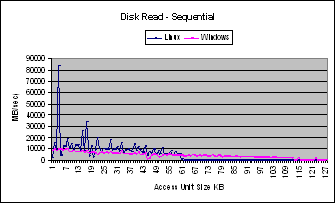
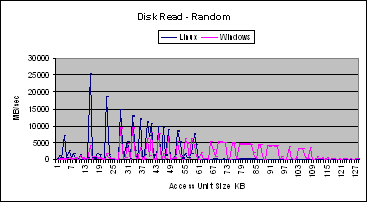
The break for page-read ahead is observed only for Linux and not on
Windows. This could be an indication that the page-read ahead limit is a
feature of each operating system.
|
|
|
Figure 41 : Graphs for comparing the disk accesses for Page Read Ahead between Linux and Windows
7.3 Process
Inline Vs Function
Vs Recursion
|
|
|
|
|
|
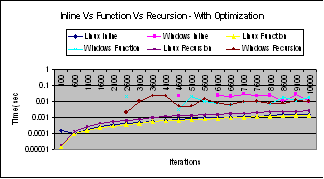
Figure 42 : Graphs comparing the times for different call types on Linux and Windows
For the different call types, Linux performs better than Windows.
This can be attributed partly to the
‘cygwin’ environment on which it is know that the fork implementations are not
optimal.
8 Conclusion
This project has been an exercise in designing metrics to test certain
features of an operating system. We have probed into some of the mechanisms
that control memory access, disk I/O, and process management and have tried to
interpret our observations based on what we know about the corresponding
operating system algorithms. We have also seen differences in behaviour while
comparing performances with and without compiler optimization and have shown
that in some cases, a careful choice of compiler optimization, can result in
better performance. All these tests have been at the user level and we have
tried to correlate our observations with documented details of the operating
system, to see how much they are actually visible to a user program.
Appendix 1
While working on this project we came across a few interesting/surprising things that we did not know about earlier.
- Inline implementations of code run faster than implementation by function call, without compiler optimization. With compiler optimization however, sometimes function call implementations can perform better than inline implementations.
- In simple ‘for’ loops with integer loop indices, the data type of the limiting variable is a significant factor in the performance of the loop. Also sometimes, higher levels of compiler optimization are not as reliable as one would expect – we saw this while trying to use a global variable and a high level of compiler optimization, and although the global variable was getting updated in the code, it did not get updated in the memory and gave numerically wrong results.
- RedHat Linux version 8.0 does not have an explicit file cache. It uses the RAM as a file cache, and stores data as dirty pages – writing to disk only periodically, or when a process requests more memory than is currently available as clean pages in the RAM.
- On Linux, a cron job runs that triggers ‘updatadb’ every few hours. This is a version of ‘locate’ which organized file metadata and rearranges files on disk to maximize file access speeds and minimize fragmentation on disk.
- If a process does repeated I/O – large number of repeated disk I/O system calls without any buffering (reading byte by byte), the process can get trapped in the kernel mode where it is just waiting for hardware I/O. This sends the process into a ‘disk sleep’ state. This could be related to the ‘standby spindown timeout’ setting via ‘hdparm’ which could send the process into this disk sleep mode. If a process went into this state – it took extremely long to get out of it. Even a small amount of buffering was enough to get around this.
- Zombie processes are created if forked children processes are explicitly terminated and not ‘waited’ for by the parent. We ran into this when we accidently forked processes and after terminating them explicitly, did not have a ‘wait’ in the parent. This showed us that the maximum number of processes that can be forked is approximately 1200.
- Working with the Cygwin UNIX Environment on Windows is the first time we have probed the system issues of a virtual machine implementation. From the documentation on the Cygwin web-site, we learnt the basic ideas behind how Cygwin emulates a UNIX shell on top of Windows, and what features of Linux have been ported efficiently and what not. Cygwin emulates a kernel by creating a shared address space for all its processes and this maintaining file and process information the way Linux does. Process creation meant the usage of part of this shared space with metadata stored to emulate the file system. Forking is expensive and uses a non copy-on-write policy, with a large number of explicit parent-child context switches. Regarding performance – processes are said to perform slower on Cygwin than on Linux, but it is not sure whether this can be attributed to the inefficiencies of Cygwin or the difference in the Unix and Windows Operating Systems.
Some additional performance tests that we could think of but have not implemented are as follows.
- A test to compare context switch times and process execution times, with sets of processes having different controlled priorities. This could have been implemented by forking processes and forcing them to multiplex by performing blocking communication between each other via a pipe, and then observing what happens when their priorities are changed and controlled using kernel calls like ‘nice’.
- A test that uses shared memory with multiple process accessing overlapping regions. This if designed properly, could be used to probe the system and observe the effect of how shared memory is handled via locks and monitors.
- Multithreaded implementations of a process could have been compared to other implementation schemes. This could have been a part of the comparison between inline, function call, recursive and forked implementations of a simple nested computation.
- A test to measure or observe the effects of interrupts.
References
[1] Maurice J. Bach, “The Design of the Unix Operating System”
[2] Andrea Arpaci-Dusseau and Remzi Arpaci-Dusseau, “Information and Control in Gray Box Systems” ,Proc, Eighteenh ACM Symposium on Operating Systems Principles, pp, 43-56,October 2001.
[3] J.K.OusterHout,”Why Aren’t Operating Systems Getting Faster as Fast as Hardware ?”,Proc, USENIX summer conference,pp.247-256, June 1990.
[4] Frigo, Leiserson,Prokop,Ramachandran,”Cache Oblivious Algorithms”, MIT Laboratory for Computer Science
[5] http://cygwin.com/usenix-98/cygwin.html
[6] Windows Performance Monitor
[7] RedHat Linux 8.0 manual pages
