
|
| The 109 GHz continuum image of Cygnus-A from OVRO millimeter array. |
| The visibility plot for AN2. Blue dots are the actual measured amplitude and phase from the interferometer while the red line is the model visibility derived from the image shown above. |
| The uv-plot for a full track used to make the image shown above. There were only 5 antennas, and the four AN2 baselines shown in the visibility plot above are marked in black while the other 6 baselines are shown in light blue. Each dot represents a single integration, and the small gaps after every 5th integration reprents calibrator observations. The length of the dashes thus represent the speed at which any given pair of baseline sweeps thru the uv-space. |
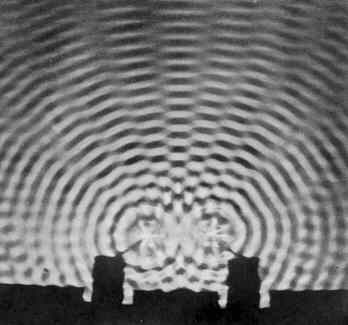
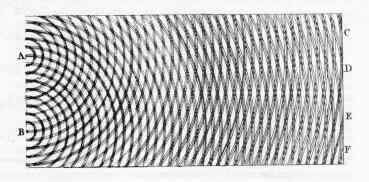
| The real part of the FFT image of Cygnus-A. The square is 50 k lambda on a side, nearly exactly matching the uv-box for the uv-plot above. The stripes represent the interference pattern among the three hot spots in Cygnus-A. By overlaying the uv-plot on top of this and tracing along one of the baseline tracks, one can reproduce the magnitude and periodicity of the modulation seen in the visibility plot. |