Mapplot
Mapplot is a program to make plots from FITS images. It can make
contour, color, or greyscale images, or combinations thereof using
two input images.
Mapplot is part of the Caltech
Package of VLBI Software. These are stand-alone programs
written to manipulate interferometry data. They are not restricted
to VLBI, and they are not interdependent. Mapplot can be used
by itself, but it does depend on PGPLOT.
Installing Mapplot
Download the compressed tar file for linux. Originally written by Tim Pearson, for VMS and
Solaris machines, a port to Linux was made by Bob Mutel. Linux users
can unpack this gzipped tar file for Linux
while Mac OS 10 users should unpack this
gzipped tar file for Mac OS 10 with:
1) mkdir mapplot; mv mapplot.tar.gz mapplot; cd mapplot
2) tar -cvzf mapplot.tar.gz
3) cd CITVLB
2) rm mapplot (the included executable will only work if you have all
       the same libraries in all the same places)
3) rm mapplot.o
4) Edit the Makefile to put in the location of the local pgplot
   installation.
5) make mapplot
6) ./mapplot  (and see if it works)
Example 1, VLBA image
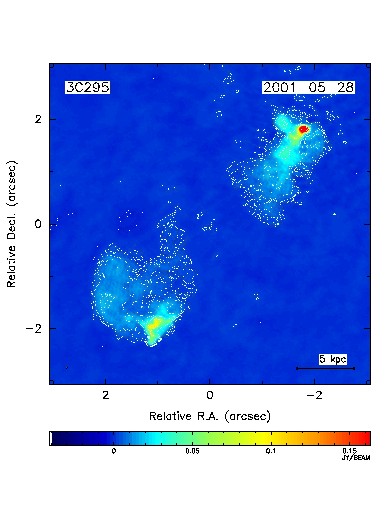
Here is an image of 3C295 made with the VLBA and a single VLA
antenna at 325 MHz. Contours are overlaid on the false color image.
All the parameters needed for making the image are described in
the shell script makecolor. This script
can then be invoked with
makecolor 3C295ampsc.cmp_n 3C295ampsc.cmp_n 0.004
This creates a postscript file called 3C295ampsc.cmp_n.ps with
contours starting at 4 mJy/beam.
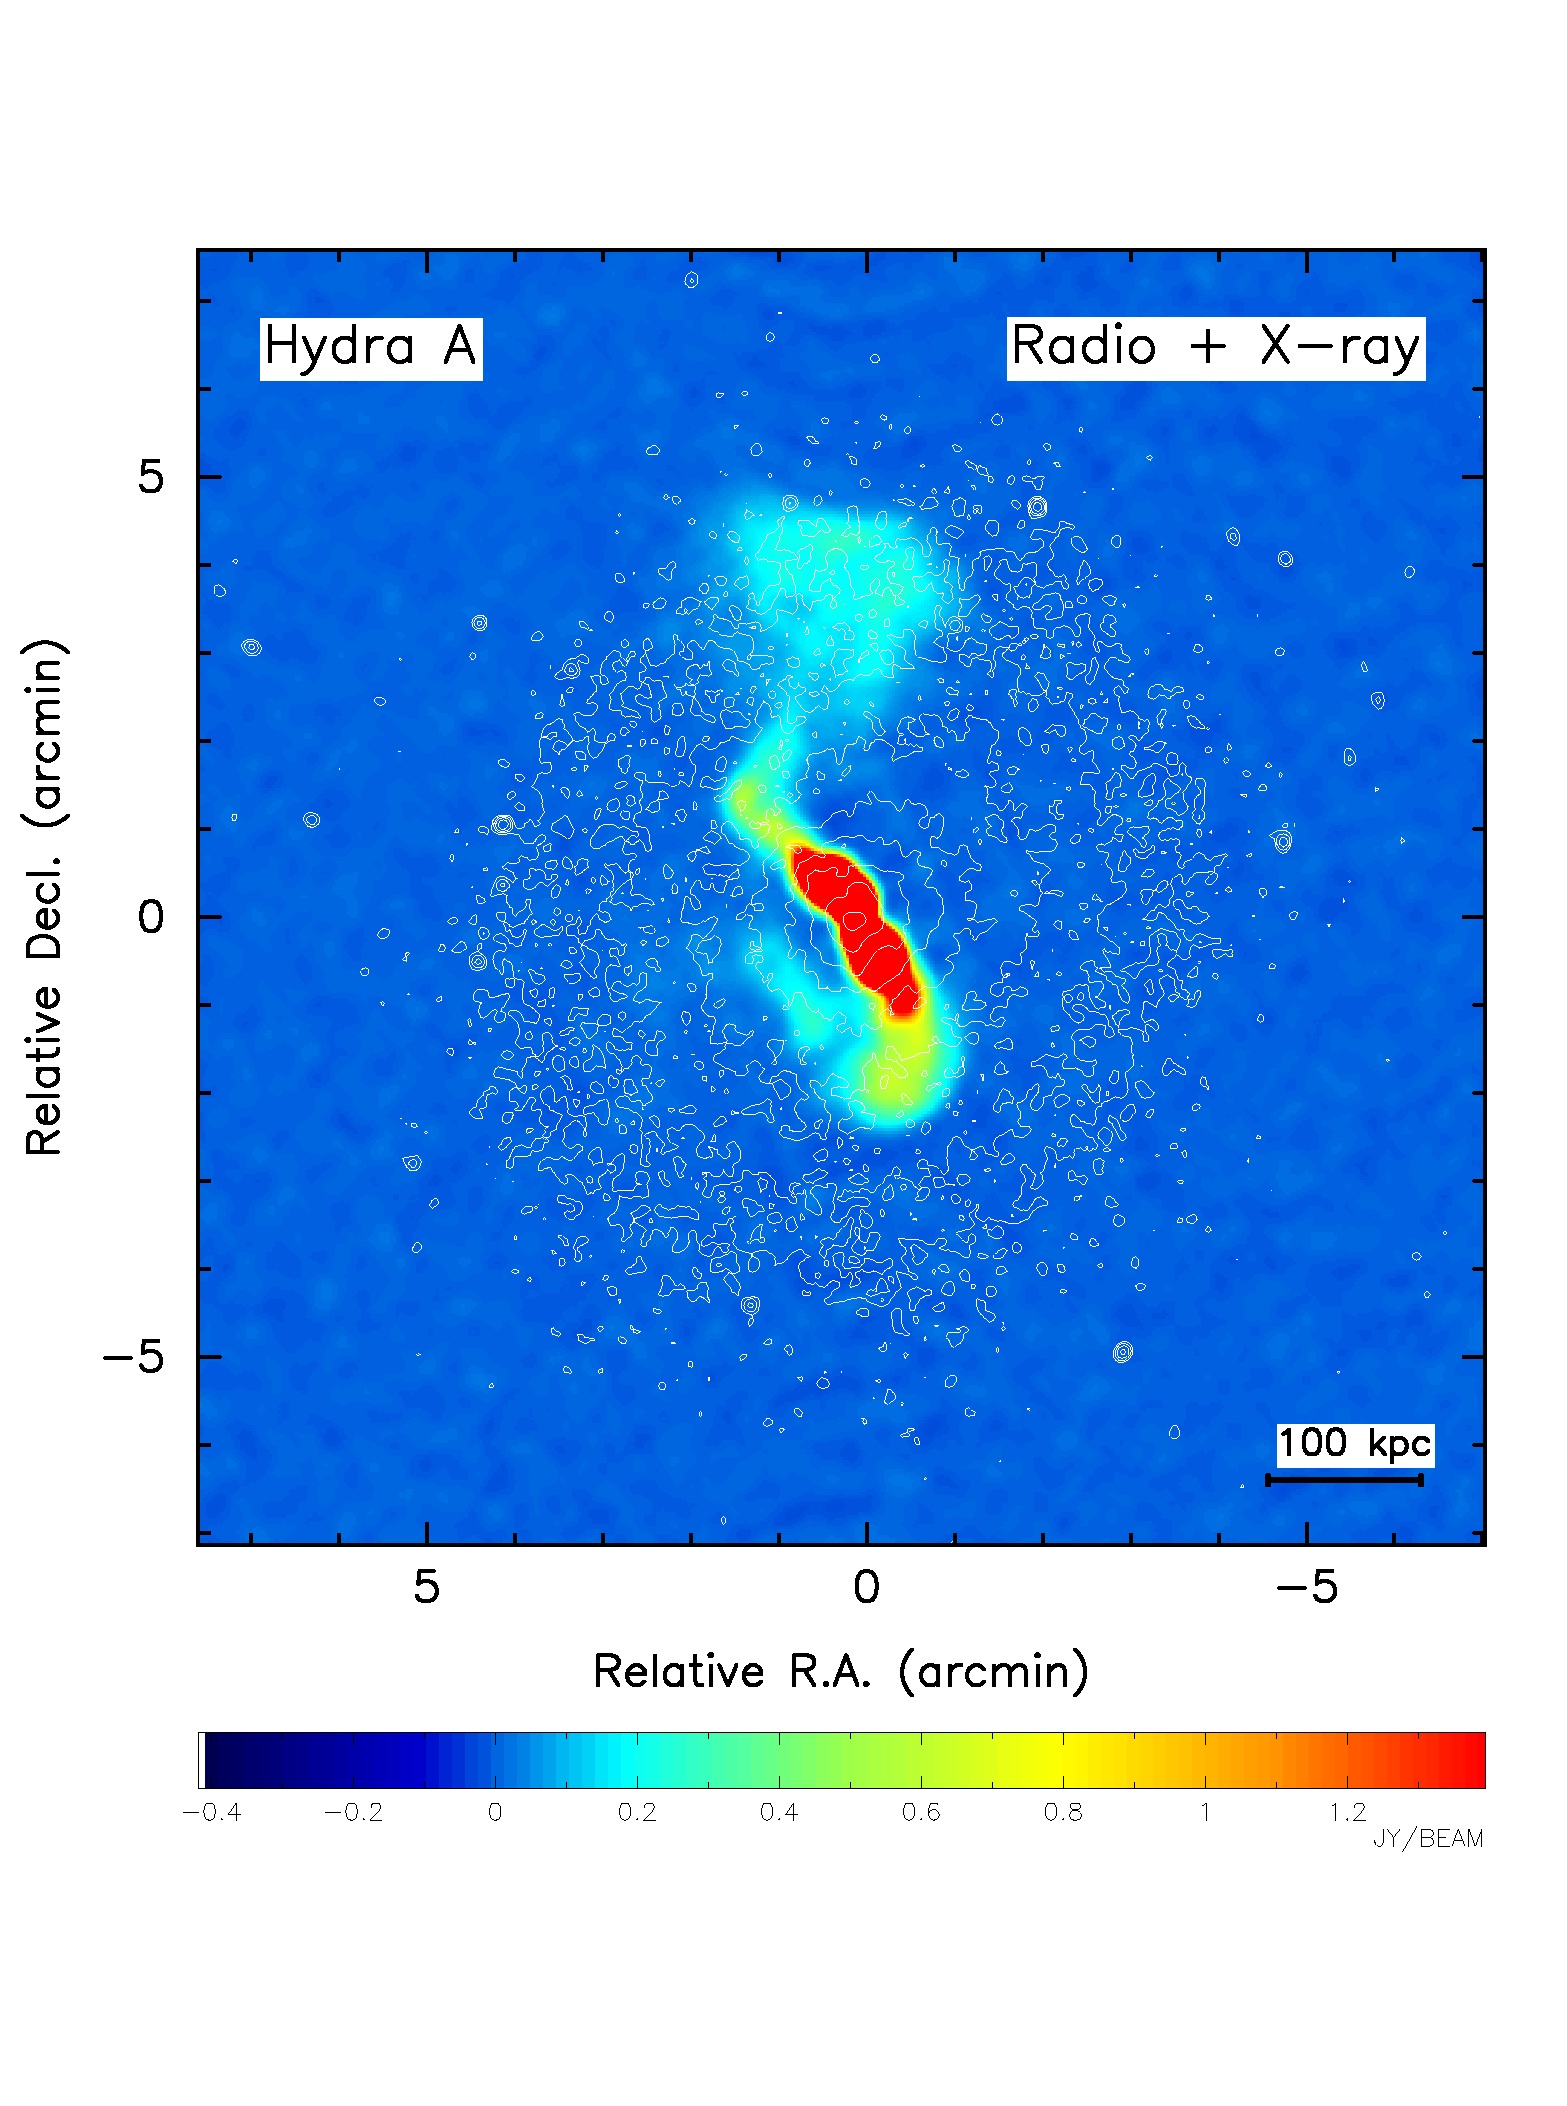
Example 2, VLA + Chandra image
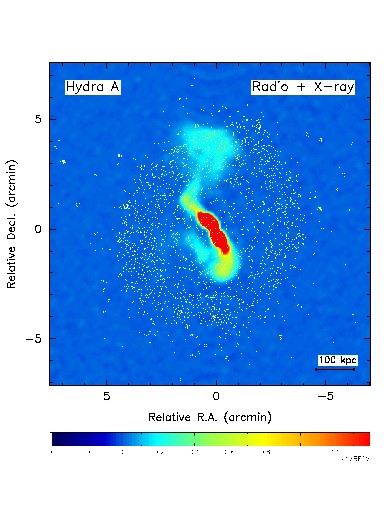
Here is an image of Hydra A made with the VLA (color) and
Chandra (contours).
All the parameters needed for making the image are described in
the shell script makerx. This script
can then be invoked with
makerx HYDRAS.FITS PABCHYD.HFLAT 0.6
This creates a postscript file called HYDRAS.FITS.ps.
Last Modified on 2002 October 16
Greg Taylor (gtaylor@aoc.nrao.edu)
Phone: (505) 835-7237; FAX: (505) 835-7027